
Independent Sustainability Verification: What It Proves
What does sustainability verification prove—and what can't it? The Wellness Quality Institute offers science-backed brand verification. Start today.
Read articleThe Wellness Quality Institute explains which microplastics testing standards apply to your sample, method, and role — clearly and in plain language.

Written by: Scott Steveson, Specialist, Wellness Quality Institute
Learn how WQI can verify your microplastics data.
This guide turns the fragmented microplastics testing standards landscape into a single decision resource organized around four evaluation lenses. It walks through the standards at a glance, a matrix-to-standard decision table, the difference between particle-based and mass-based quantification, the gap between definitions and validated detection floors, why two laboratories citing the same standard can report non-comparable numbers, and what a compliant result does and does not support as a public claim.
The four lenses apply in sequence to every standards-selection decision:
Each lens is developed in the sections that follow.
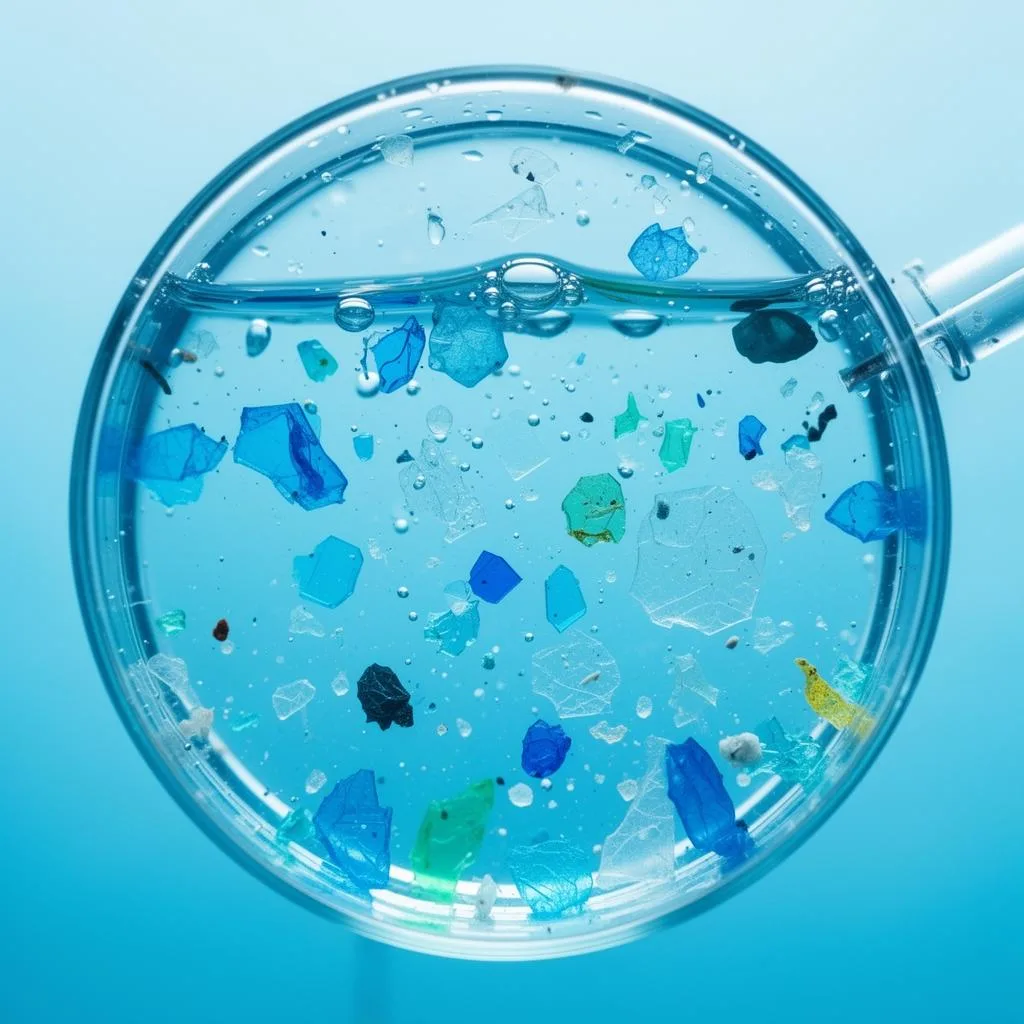
Plastics are polymer materials such as polyethylene (PE), polypropylene (PP), polyethylene terephthalate (PET), polystyrene (PS), PVC, and nylon. When plastic objects break down under sunlight, heat, and mechanical stress, they fragment into progressively smaller pieces that keep their chemical identity as polymers. The field sorts these fragments by size: microplastics are particles smaller than 5 mm and nanoplastics are particles smaller than 1 µm, roughly a thousandth of a millimeter. Definitions vary across documents, so two standards that define the same term differently create datasets that readers cannot compare directly.

ISO 24187:2023 is the framework standard that sets general principles for the analysis of microplastics in the environment. It is a principles document rather than a step-by-step method. Method-specific suitability and equivalence must be demonstrated separately against the applicable sampling, preparation, and analysis documents. That separation fragments the landscape because sampling, preparation, and analysis each sit in different documents, and a laboratory can be strong in one area and weak in another.
As of September 2026, the landscape includes established standards (ISO 24187:2023, ISO 5667-27:2025, ISO 16094-2:2025, ASTM D8332-20, ASTM D8333-20, ASTM D8401-24, and the California State Water Board SWB methods), emerging standards (ISO 16094-3, still in final-draft or approval stage), and a notable absence. There is no US federal consumer-product microplastics testing standard. As the US EPA stated in its proposed UCMR 6 rule published July 1, 2026, there is no validated EPA or consensus drinking water analytical method with the quality control data, accuracy, and precision needed for regulatory use, and developing one within the statutory timeframe was not feasible.
The standards below are grouped by the role they play in a typical testing workflow: framework, sampling, preparation, and analysis. Each entry lists its number, year, scope, matrix, method, and reporting unit. None of these standards were authored by the Wellness Quality Institute; each belongs to its issuing body.
ISO 24187:2023 – Plastics — Principles For The Analysis Of Microplastics Present In The Environment. Issued by ISO. Matrix: environmental samples such as water, sediment, and biota. Method: framework only that supports vibrational micro-spectroscopy such as IR and Raman and thermo-analytical methods such as GC-MS but does not specify a validated procedure. Reporting unit: not specified because it is a principles document. Validated range: defines microplastics as particles between 1 µm and 5 mm and sets a particle size classification of 1–1,000 µm. This range is definitional and does not represent a detection floor.
ISO 5667-27:2025 – Water Quality — Sampling — Part 27: Guidance On Sampling For Microplastics In Water. Issued by ISO/TC 147. Matrix: domestic water, freshwater, seawater, and treated and untreated wastewater. Method: grab sampling, including cascade filtration, and net sampling. Reporting unit: not applicable because this standard covers sampling only and explicitly excludes chemical analysis, biological methods, and pre-treatment or digestion methods. Validated range: cascade filtration mesh sizes can reach 1 µm and net mesh sizes typically range from 50–500 µm.
ASTM D8332-20 – Standard Practice For Collection Of Water Samples With High, Medium, Or Low Suspended Solids For Identification And Quantification Of Microplastic Particles And Fibers. Issued by ASTM International. Matrix: water, grouped by suspended-solids level. Method: field sampling practice that governs collection only and not analysis. Reporting unit: not applicable because it is a sampling practice. Validated range: not specified apart from the downstream analysis.
ASTM D8333-20 – Standard Practice For Preparation Of Water Samples For Identification And Quantification Of Microplastic Particles And Fibers. Issued by ASTM International. Matrix: drinking water, surface waters, wastewater influent and effluent, and marine waters. Method: peroxide oxidation followed by progressive enzymatic digestion, with downstream analysis by Raman spectroscopy, IR spectroscopy, or pyrolysis-GC/MS. Reporting unit: determined by the downstream analytical method. Validated particle-size range runs from 20 µm to 5,000 µm.
ISO 16094-2:2025 – Water Quality — Microplastics In Water — Part 2: Determination Of Microplastics In Waters With Low Suspended Solids Using Vibrational Spectroscopy. Issued by ISO. Matrix: drinking water and other low-suspended-solids water. Method: vibrational spectroscopy using FTIR or Raman. Reporting unit: particle count by size fraction in particles per liter. Validated range: 1 µm to 5,000 µm across four fractions of 1–20 µm, 20–212 µm, 212–500 µm, and above 500 µm, with a practical analytical floor near 20 µm for routine validated quantification.
ISO 16094-3 – Thermo-analytical methods for microplastics in waters with low suspended solids. Status as of September 2026: still in final-draft or approval stage and not yet published as a full International Standard. Readers should avoid citing it as a published method.
ASTM D8401-24 – Standard Test Method For Determination Of Microplastics In Water By Pyrolysis Gas Chromatography Mass Spectrometry (Py-GC/MS). Issued by ASTM International. Matrix: water with high to low suspended solids, including treated drinking water, surface water, marine water, and wastewater. Method: pyrolysis GC/MS, a destructive technique that thermally decomposes the sample. Reporting unit: polymer mass in µg/L or mg/kg. Samples are reduced to fine powder below 0.2 mm, so the method can handle nanoparticles but produces no particle count, size distribution, or morphology data.
California SWB-MP1-rev1 – Standard Operating Procedures For Extraction And Measurement By Infrared Spectroscopy Of Microplastic Particles In Drinking Water. Issued by the California State Water Resources Control Board. Matrix: drinking water. Method: infrared spectroscopy using FTIR. Reporting unit: particle count by size fraction in particles per liter. Validated range: greater than 50 µm through 5,000 µm.
California SWB-MP2-rev1 – Standard Operating Procedures For Extraction And Measurement By Raman Spectroscopy Of Microplastic Particles In Drinking Water. Issued by the California State Water Resources Control Board. Matrix: drinking water. Method: Raman spectroscopy. Reporting unit: particle count by size fraction in particles per liter. Validated range: greater than 20 µm through 5,000 µm.
Now that you have seen the individual standards and their roles, the next step is matching them to your specific sample. The table below maps sample matrix to governing standard, method, and reporting unit. Notice that no single standard covers the full workflow for any matrix. Sampling, preparation, and analysis always sit in different documents, which is a core reason results are hard to compare. Every data point is drawn from the standards themselves or from the sources cited in this article. Particle-count and mass-based values appear in separate columns because they answer different questions and cannot be compared directly.
| Sample Matrix | Governing Standard(s) | Method | Reporting Unit |
|---|---|---|---|
| Drinking water / low-solids water | Sampling: ISO 5667-27:2025. Analysis: ISO 16094-2:2025. Regulatory reference: SWB-MP1-rev1 / SWB-MP2-rev1. | Vibrational spectroscopy using FTIR or Raman | Particles per liter by size fraction |
| Wastewater / high-solids water | Sampling: ISO 5667-27:2025. Preparation: ASTM D8333-20. Analysis: ASTM D8401-24 for mass or FTIR or Raman for particle counts. | Pyrolysis GC/MS or vibrational spectroscopy | µg/L or mg/kg for mass and particles per liter for particle counts |
| Surface water / ambient water | Sampling: ISO 5667-27:2025 or ASTM D8332-20. Preparation: ASTM D8333-20. Analysis: ISO 16094-2:2025 or ASTM D8401-24. | Vibrational spectroscopy or Py-GC/MS | Particles per liter for particle counts or µg/L for mass |
| Soil / sediment | No ISO or ASTM standard is fully validated for this matrix as of September 2026. ISO 24187:2023 provides general principles only. | Method suitability must be demonstrated for the specific matrix | Particles per kilogram or mg/kg depending on method |
| Consumer product / simple-liquid product | No dedicated microplastics testing standard exists for consumer or simple-liquid products. Certification schemes such as Control Union’s Microplastic-Free scheme reference the draft standards ISO/DIS 16094-2 and ISO/DIS 16094-3 when matrix suitability is demonstrated. | Vibrational spectroscopy when validated for the specific matrix | Particles per liter by size fraction when validated |
For product and simple-liquid matrices, method suitability for the specific matrix must be demonstrated separately. A method validated for drinking water does not automatically apply to a beverage, supplement, or other consumer-product matrix. Matrix equivalence requires a documented technical determination.
Particle-based methods such as FTIR and Raman spectroscopy count and chemically identify individual particles and report results as particles per liter, organized by size fraction. Mass-based methods such as pyrolysis GC/MS, as specified in ASTM D8401-24, report polymer mass, typically in µg/L or mg/kg. These approaches are not interchangeable and cannot be compared directly. A particle count and a mass figure answer different questions about the same sample.
Particle counts support statements about particle presence, size distribution, and polymer identity within the tested range. Mass-based results support questions about polymer-mass loading and can capture smaller particles that fall below the optical resolution of spectroscopic methods. They do not produce a countable particle inventory, a size distribution, or morphology data. Datasets from spectroscopic and thermo-analytical methods are difficult to integrate because they represent fundamentally different data types.
For most technical buyers working with water or simple-liquid matrices, the practical choice lies between ISO 16094-2:2025 and ASTM D8401-24. ISO 16094-2:2025 uses vibrational spectroscopy for particle-level characterization in low-solids water. ASTM D8401-24 uses pyrolysis GC/MS for polymer-mass quantification across a wider solids range. ISO 16094-2:2025 produces a particle count with size fractions and polymer identification. ASTM D8401-24 produces a polymer mass figure with no particle inventory. These standards generate different data types, so datasets from the two cannot be integrated directly. Selecting between them requires clarity on the reporting objective before testing begins.
Understand what your microplastics testing standard actually measures — talk to WQI.
The measurement gap is the central concept in microplastics testing and explains why no standard-compliant result supports an absolute claim of absence.
ISO 24187:2023 sets a definitional lower bound at 1 µm. The California State Water Board’s drinking-water definition reaches down to 1 nanometer across at least three dimensions. The best validated commercial methods begin around 20 µm for Raman spectroscopy under SWB-MP2-rev1 and around 50 µm for infrared spectroscopy under SWB-MP1-rev1. The 1–20 µm fraction is not validated under either California method. Everything below 1 µm, which is the nanoplastic range, currently sits beyond reliable commercial measurement.
The practical consequence is direct. Detection can establish presence, yet it cannot establish absence. A result reported as “none detected” means none were found above that instrument’s detection floor, which is the lowest concentration or particle size the method can reliably identify, for the polymers screened and in the lot tested. It does not mean none are present. Optical microscopy’s resolution generally limits detection of microplastic particles to sizes above about 20 µm. That limit creates a common validated detection floor well above the 1 µm definitional floor mentioned earlier.
This gap is a hard technical limit rather than a failure of diligence. No method detects every particle size, so every result has a lower boundary. No single test screens every polymer type across every product format, so a clean result always remains partial. A clean result on one production lot does not guarantee the next, so a single test cannot speak for ongoing production. Together, these limits explain why standards exist and why no standard-compliant result supports an absolute claim.
Sampling under ISO 5667-27:2025, preparation under ASTM D8333-20, and analysis under ISO 16094-2:2025 or ASTM D8401-24 sit in separate documents. A laboratory can excel at one stage and fall short at another. Citing the same standard number does not make two laboratories’ results comparable when their workflows differ at any stage.
The practical variables that break comparability fall into three groups.
As the US EPA stated in its proposed UCMR 6 rule, analytical methods for microplastics are less standardized than sampling and preparation methods. Even sampling and preparation methods are not yet fully harmonized for interlaboratory equivalence. Method equivalence must be demonstrated. ISO 16094-2:2025 and the California SWB methods do not automatically substitute for one another.

Blank controls illustrate the stakes clearly. A 2024 PNAS study reported approximately 240,000 plastic particles per liter in bottled water, roughly 90% of them nanoplastics. That figure became widely cited. A subsequent PNAS commentary found that the study’s procedural blanks appeared contaminated and its quality control was inadequate. The critique turns on blank controls, which are the same contamination checks that any compliant method requires. The number is a live demonstration of why method review matters as much as the result itself.
Get an independent review of your microplastics testing standards and dataset.
A standard-compliant result supports a statement about what was found or not found within the tested particle-size range, using the named method, for the specific product and production period reviewed. It does not support any absolute claim of absence because no laboratory today can confirm the complete absence of plastic across every particle size, polymer type, and production lot.
Scope lock, meaning the rule that a result applies only to the reviewed product, dataset, tested range, polymer panel, and production period, marks the boundary between a defensible claim and an unsubstantiated one. Extending a single product’s result across a product line or a company turns credible data into a claim that the data cannot support.
The Wellness Quality Institute (WQI) is an independent verification body that does not run laboratory tests. Its Plastic-Free Pathway Verification program, governed by the standard WQI-CS-01, reviews a company’s existing independent laboratory dataset, testing methodology, product scope, and supporting controls against defined criteria focused on particle size and polymer type. These criteria align with the California State Water Board’s drinking-water microplastics reference framework. California serves as a technical reference point rather than a geographic boundary, and verification is available to US companies nationally. California did not create, approve, authorize, or endorse WQI or its standard.
WQI reviews laboratory qualification by accreditation tier. California ELAP accreditation for the applicable SWB method is preferred. ISO/IEC 17025 accreditation, which is the international standard for laboratory competence, is accepted when the microplastics method and the matrix appear explicitly within the accredited scope. Other qualified independent laboratories may be conditionally accepted through documented method-equivalence review. On cost, a single assessment fee covers review, the verification decision, and registry listing. There is no separate mark-license or registry fee. Independent laboratory testing is arranged and billed separately by a qualified independent laboratory. WQI’s Phase 1 focus is water and suitable simple-liquid products, where testing methods are most defensible.
WQI Plastic-Free Pathway Verification does not certify that a product contains zero plastic, microplastics, or nanoplastics. It shows that the company is on a verified pathway toward plastic-free standards. Verification applies only to the reviewed products, submitted datasets, tested ranges, polymer panels, production or sampling periods, and supporting controls. WQI verification is not a California approval, government certification, or health or safety certification.
Before commissioning testing or accepting a lab report, apply the following checklist across four categories.
The errors below appear frequently in how microplastics results are commissioned, interpreted, and communicated. Each one traces back to a structural feature of the standards landscape.
Most of these errors arise because sampling, preparation, and analysis are governed by separate documents and because readers confuse the definitional range with the validated detection range. The distance between those two ranges is the measurement gap described earlier.
Turn your microplastics testing standards data into a claim you can support.
No single method works best for every situation. The right method depends on your sample matrix and reporting objective. Vibrational spectroscopy using FTIR or Raman produces particle-level counts and polymer identification, organized by size fraction, and suits objectives focused on which particles are present and at what sizes. Pyrolysis GC/MS produces polymer mass data and suits objectives focused on total polymer loading by mass. The standard you select must match both your matrix and your reporting objective. A method that is well validated for drinking water may require additional demonstration of suitability before use with a beverage or supplement matrix.
ISO 5667-27:2025 governs sampling for drinking water and other water matrices. ISO 16094-2:2025 governs analysis by vibrational spectroscopy for low-solids waters including drinking water and covers particles from 1 µm to 5,000 µm across four size fractions, with a practical analytical floor near 20 µm for routine validated quantification. The California State Water Board’s SWB-MP1-rev1, which uses infrared spectroscopy with a validated range greater than 50 µm through 5,000 µm, and SWB-MP2-rev1, which uses Raman spectroscopy with a validated range greater than 20 µm through 5,000 µm, serve as the regulatory reference framework in California and as a technical reference point for organizations such as WQI. These methods do not automatically interchange with ISO 16094-2:2025, so method equivalence must be demonstrated.
ISO 24187:2023 is a framework standard that establishes general principles for the analysis of microplastics in the environment. It is not a step-by-step testing method. It defines microplastics as particles between 1 µm and 5 mm and specifies a particle size classification of 1–1,000 µm, supports vibrational spectroscopy and thermo-analytical approaches, and provides the definitional anchor for most downstream standards. Method-specific suitability and equivalence must be demonstrated separately against the applicable sampling, preparation, and analysis documents. Citing ISO 24187:2023 alone does not explain how a sample was collected, prepared, or analyzed.
Particle-based methods such as FTIR and Raman spectroscopy count and chemically identify individual particles and report results as particles per liter, organized by size fraction. They are non-destructive, so the filter can be archived and reanalyzed. Mass-based methods such as pyrolysis GC/MS, as specified in ASTM D8401-24, thermally decompose the sample and report polymer mass in µg/L or mg/kg. They are destructive, so the sample cannot be recovered or reanalyzed. As noted earlier, these data types are not comparable.
Reports

What does sustainability verification prove—and what can't it? The Wellness Quality Institute offers science-backed brand verification. Start today.
Read article
The Wellness Quality Institute helps brands turn plastic lab results into defensible claims. Get independent review you can trust. Learn more.
Read article
Can a product really be plastic-free? The Wellness Quality Institute turns lab data into honest, scope-locked microplastics claims. Learn how.
Read article