
Microplastics Analysis Techniques: What Each Method Proves
Not all microplastics tests are equal. The Wellness Quality Institute breaks down FTIR, Raman, and more — so you choose the right method.
Read articleMatch your microplastic test method to your matrix and claim. The Wellness Quality Institute guides you from detection to plastic-free verification.

Written by: Scott Steveson, Specialist, Wellness Quality Institute
Microplastic analysis uses multi-step workflows where method choice directly determines what claims the data can support. FTIR, Raman, and pyrolysis GC-MS each have distinct validated ranges and limitations.
Validated detection floors for spectroscopic methods, 50 µm for FTIR and 20 µm for Raman, leave significant gaps below these thresholds that cannot support claims about absence.
Matrix type, such as water, soil, air, tissue, or food, determines which analytical methods are defensible and what caveats must accompany any resulting claims.
Quality assurance elements like procedural blanks, spike recoveries, and chain-of-custody documentation turn laboratory results into defensible findings instead of uninterpretable numbers.
Organizations seeking to substantiate plastic-related claims can have their laboratory data independently reviewed through Plastic-Free Pathway Verification.
Microplastics appear widely in water and consumer products. A 2018 peer-reviewed study by Kosuth, Mason, and Wattenberg in PLOS ONE found anthropogenic particles in 81% of 159 tap water samples sourced across five continents. A separate 2018 study led by Sherri Mason at the State University of New York at Fredonia, published in Frontiers in Chemistry, found contamination in 93% of 259 bottled water samples across eleven brands, with polypropylene, the material used in bottle caps, as the most commonly identified polymer.

Plastic-related claims are rising alongside detection. The analytical methods behind those claims differ greatly in what they can actually see. The same sample analyzed by two different methods can produce two different results, because each method has a different detection floor, meaning the lower size boundary below which it cannot reliably find anything. That floor sets the boundary of every claim the data can support. Many companies pick a method before deciding which claim they need to support, and that sequence often creates costly problems.
This guide follows a clear decision sequence: matrix first, then method, then detection floor, then claim, grounded in published standards and technical limits.
That decision sequence plays out inside a workflow with four stages, and each stage is a decision point where evidence can be lost or corrupted.
Sampling determines what enters the analytical pipeline. Errors here, such as wrong container material, inadequate volume, or airborne synthetic fiber contamination, cannot be corrected downstream. Standardized sampling protocols, such as those outlined in ISO 5667-27:2025, exist because sampling variability is a primary driver of disagreement between laboratories.
Sample preparation includes filtration, chemical digestion, which means breaking down organic material so plastic particles can be isolated, and density separation, which uses salt solutions to float lower-density polymers away from heavier matrix material. Bruker’s microplastics analysis guidance calls this the most critical step in the workflow and the primary source of variability between laboratories. Incomplete digestion leaves organic residue that interferes with polymer identification, while filter choice determines which particle sizes are retained and density separation misses high-density polymers such as PET and PVC that sink rather than float. Each of these failure modes changes what the result can support.
Identification and quantification, the instrument step, is where method choice becomes claim choice. FTIR and Raman identify particles individually and provide polymer type, particle count, size, and morphology. Pyrolysis GC-MS reports total polymer mass and cannot attribute that mass to a specific particle, a specific size, or a specific count. A 2026 review by Alotaishan et al. in Nutrition and Metabolic Insights states explicitly that these are not interchangeable metrics.
QA/QC, meaning quality assurance and quality control, covers blanks, spike recoveries, replicates, and chain-of-custody documentation that show whether a result reflects the sample rather than the laboratory. QA/QC runs through every stage instead of sitting at the end. A result without documented blanks cannot be interpreted reliably, for reasons described later in this guide.
The matrix, meaning the physical substance being tested, determines which methods are defensible and which require heavy caveats. A 2026 critical review by Mallek and Barceló in the Journal of Xenobiotics concludes that no single technique can yet provide comprehensive characterization across all environmentally relevant particle-size classes and matrix types, which makes method selection both matrix- and size-dependent.
Drinking water and simple liquids are the matrices where spectroscopic methods are most defensible today. Low suspended-solids content reduces interference, and both SWB-MP1-rev1 and SWB-MP2-rev1 were validated specifically for this matrix as examples of published standards. ISO 16094-2:2025 similarly covers vibrational spectroscopy methods for waters with low suspended-solids content, including drinking water.
Soil and sediment present substantially greater challenges. A 2026 review in Microplastics and Nanoplastics notes that the absence of harmonized methodologies for soil analysis challenges comprehensive quantification and limits data comparability. Organic interference, matrix complexity, and digestion losses all change what any result can support. Claims derived from soil analysis require explicit method documentation and clear caveats about what the detection floor covers.
Air and atmospheric deposition introduce contamination-control challenges that are particularly acute. Airborne synthetic fibers are a known source of procedural contamination in any microplastics workflow, and distinguishing environmental signal from laboratory background requires rigorous field and procedural blanks.
Biological tissue, including human blood, placenta, lung, and brain, is the most analytically demanding matrix. Lipid-rich tissues interfere with digestion and polymer identification. A 2026 narrative review by Berber et al. in Biology (Basel) documents that reported concentrations of micro- and nanoplastics vary by one to three orders of magnitude between laboratories analyzing similar biological matrices. A biological signal is credible only when polymer identification is orthogonal, meaning confirmed by at least two independent analytical methods, and procedural blanks are reported and subtracted transparently.
Food introduces contamination from processing, packaging, and transportation in addition to environmental sources. Food sampling protocols must account for contamination at every stage, and the complexity of food matrices introduces organic interference comparable to biological tissue.
Detection limits in microplastic analysis sit at the center of what any claim can honestly say.
The California State Water Board’s drinking-water definition covers solid polymeric material with particles having at least three dimensions greater than 1 nanometer and less than 5,000 micrometers. That definition deliberately spans a very wide size range.
The validated methods do not cover that full range. SWB-MP1-rev1, which uses infrared spectroscopy, is validated for particles greater than 50 µm through 5,000 µm. SWB-MP2-rev1, which uses Raman spectroscopy, is validated for particles greater than 20 µm through 5,000 µm. The 1–20 µm fraction is not validated under either method. Everything below 1 µm, the nanoplastic range, currently sits beyond reliable commercial measurement.
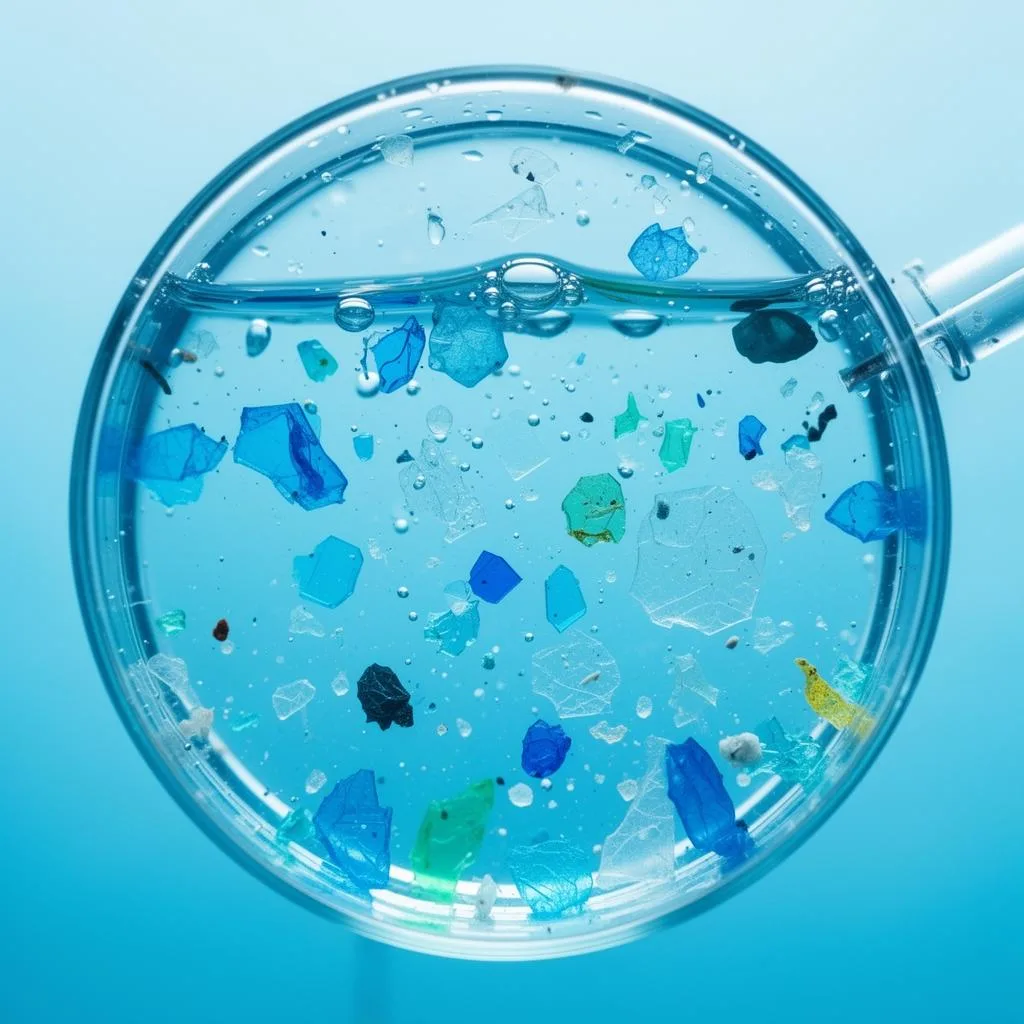
To put the gap in concrete terms, the California definition reaches down to 1 nanometer, while the best validated methods begin at 20 or 50 micrometers, which are thousands of times larger. A California sampling guidance document notes that a minimum analytical particle size of 50 µm was recommended because methods had not yet been evaluated below that size range.
This gap shapes how to read a result. A finding of “none detected” means none found above that instrument’s detection floor, for the polymers screened, in the lot tested. The statement has clear boundaries. Detection confirms what is there; it cannot confirm what is not.
The three principal techniques fall into two different analytical approaches, and that choice determines what kind of claim the data can support.
FTIR and Raman spectroscopy identify particles individually. They are non-destructive, meaning the sample is preserved for re-analysis or archival, and they report particle count, polymer type, size, and morphology. Bruker’s microplastics analysis guidance describes particle-driven techniques such as FTIR and Raman microscopy as non-destructive methods that permit archival storage and retrospective reanalysis under future regulatory requirements or updated polymer libraries.
Pyrolysis GC-MS is destructive, so the sample is consumed in the analysis. It reports total polymer mass, such as how many micrograms of polyethylene are present per gram of sample, but cannot attribute that mass to a specific particle, a specific size, or a specific count. As the Alotaishan et al. 2026 review states, presence or absence claims from FTIR or Raman are bounded by the method’s size cutoff, while Py-GC-MS supports mass-based claims but not claims about intact particles. The table below summarizes how the three techniques differ on the dimensions that matter most for claim selection.
|
Technique |
Information Provided |
Validated Size Range |
Destructive? |
|---|---|---|---|
|
FTIR spectroscopy (SWB-MP1-rev1) |
Polymer type, particle count, size, morphology |
>50 µm through 5,000 µm |
No |
|
Raman spectroscopy (SWB-MP2-rev1) |
Polymer type, particle count, size, morphology |
>20 µm through 5,000 µm |
No |
|
Pyrolysis GC-MS |
Total polymer mass by type; no particle count, size, or morphology |
No equivalent validated particle-size range under the California framework; mass-based, not particle-based |
Yes |
Particle-count claims require FTIR or Raman, while polymer-mass claims require Py-GC-MS. If a company wants to re-analyze the same sample later, it also needs a non-destructive method. These choices are specific to the claim and cannot be swapped without changing what the data means.
Quality assurance and quality control, meaning the procedural safeguards that show whether a result reflects the sample rather than the laboratory, sit at the core of any defensible microplastic analysis. They provide the structure that turns a number into a finding.

The core QA/QC elements for any microplastic analysis include:
Procedural blanks: controls that mimic actual sample handling and processing, so background contamination can be measured under the same conditions as the samples. A polymer match also found in blanks should be treated as low-confidence unless a clear spatial, temporal, or process gradient supports the sample-specific interpretation.
Field blanks: controls collected at the sampling site to monitor contamination introduced during collection, not just during laboratory processing.
Spike recoveries: known quantities of reference microplastic particles added to clean samples to verify that the full analytical workflow, including preparation, filtration, and identification, is capturing what it should. ISO 16094-2:2025 requires a minimum recovery rate of 60% across the full claimed analytical range as an example of a published standard.
Replicates: repeated measurements to establish precision and identify outliers.
Chain of custody: documentation of sample handling from collection through analysis, which shows that the sample analyzed is the sample collected.
Reporting limits: the lowest concentration the method can reliably report, which must meet defined requirements for a result to be usable.
The 2024 PNAS bottled-water study shows why blank controls matter in practice. A 2024 PNAS study by Qian et al. at Columbia University reported approximately 240,000 plastic particles per liter of bottled water, with roughly 90% identified as nanoplastics, a striking figure that received wide attention. That figure must always be reported alongside a subsequent PNAS commentary finding that the study’s procedural blanks appeared contaminated and its quality control inadequate. The critique turns entirely on blank controls, the same contamination controls that any defensible microplastic analysis requires. The number becomes a demonstration of why method review matters as much as the result itself.
Several published standards provide reference frameworks for microplastic analysis. These documents improve consistency but do not remove variability between laboratories or cover every matrix and claim type.
ISO 16094-2:2025 specifies vibrational spectroscopy methods for microplastics in waters with low suspended-solids content, including drinking water, covering particles from 1 µm to 5,000 µm. It functions as a laboratory method standard rather than a monitoring program or regulatory threshold document. It also is not automatically interchangeable with the California SWB methods, so method-specific suitability and equivalence must be demonstrated separately.
ISO 24187:2023 defines general principles for analysis of microplastics across environmental matrices including water, sediment, and biota. It addresses sample preparation requirements and reporting, but suitability still must be demonstrated separately for each application.
ISO/IEC 17025:2017 sets general requirements for the competence of testing and calibration laboratories and forms the accreditation basis on which laboratory qualification is assessed.
The California State Water Board’s SWB-MP1-rev1 and SWB-MP2-rev1 standard operating procedures were validated through a 22-laboratory interlaboratory study, as noted in Science and Medicine Group’s drinking-water monitoring analysis, and represent a stringent publicly available reference framework for drinking-water microplastics analysis.
Results still vary between laboratories even under the same standard. Instruments and detection floors differ, and capability varies not only between laboratories but within them depending on the instrument and method used. There is currently no US federal standard for microplastics in consumer products. As noted in the Science and Medicine Group analysis, the EPA omitted microplastics from its proposed Sixth Unregulated Contaminant Monitoring Rule published in July 2026, because no validated, standardized EPA analytical method for microplastics in drinking water exists.
A detection floor sets a clear boundary for any claim. A method validated above 50 µm cannot support statements about particles below 50 µm, and one validated above 20 µm is similarly bounded at 20 µm. No method currently available can support a claim that a product is free of plastic.
Plain-language translation of what a lab report does and does not license:
“No microplastics detected” means none found above this instrument’s detection floor, for the polymers screened, in the lot tested.
It does not mean particles are absent below the detection floor.
It does not mean polymers outside the tested panel are absent.
It does not mean other production lots will produce the same result.
It does not mean the product is free of plastic.
Before treating an existing dataset as the basis for a public claim, use the following checklist as a minimum screen:
Is the laboratory accredited, and is the specific method and matrix within its accredited scope?
Is the analytical method appropriate for the product matrix?
What is the tested particle-size range, and does it cover the range relevant to the claim?
What polymer panel was screened, and does it include the polymers relevant to the product and packaging?
What are the reporting limits, and do they meet the requirements of the applicable standard?
Were procedural and field blanks run and reported?
Were spike recoveries performed and documented?
Were replicate measurements taken?
Is chain of custody documented from collection through analysis?
Is the data recent enough to reflect current production?
Does the product scope of the dataset match the product scope of the intended claim?
Many organizations discover, after working through this checklist, that their existing data supports a narrower or a stronger claim than they first assumed.
The Wellness Quality Institute (WQI) is an independent verification body that reviews companies’ existing third-party laboratory data on plastic and microplastic content against a defined standard. This process helps brands substantiate real progress toward plastic-free standards instead of promising impossible zero-plastic claims.
The problem WQI addresses is specific. A company holds a laboratory dataset and does not know whether the method, reporting limits, blanks, and scope are adequate to support any public claim. A lab report alone does not become a defensible market claim. Self-reported results carry less weight than independently reviewed data. Without independent review, even rigorous data is often perceived as marketing.
WQI’s core program, Plastic-Free Pathway Verification (PFPV), is governed by the standard WQI-CS-01. WQI reviews a company’s existing independent laboratory dataset, testing methodology, product scope, and supporting controls against defined criteria. These criteria align with the California State Water Board’s drinking-water microplastics reference framework as a technical reference point rather than a geographic boundary. Verification is available to US companies nationally, not only in California. California did not create, approve, authorize, or endorse WQI or its standard.
WQI does not run laboratory tests. Every review produces one of two outcomes:
Standard Met: the dataset satisfies all applicable technical and data-quality requirements, and no reportable target polymer particles are detected within the tested particle-size range and approved reporting limits. This outcome carries a verification decision, a scope-locked license to use the WQI mark (“WQI Plastic-Free Pathway Verified”), a public registry listing, and approved claim language.
Standard Not Met: one or more requirements are unsatisfied. This outcome is private and carries no public claim, no logo rights, and no registry listing, and is never described as a failed product. It may reflect insufficient data, an unsupported method, or incomplete scope rather than anything about the product itself. The company may resubmit with corrected or additional information.
Verification is locked to the reviewed product, dataset, tested particle-size range, polymer panel, and production period. No company-wide or product-line claim may be extended from a single dataset. The verification period is 24 months from the sampling date of the most recent accepted dataset. A single assessment fee covers review, verification decision, and registry listing, with no separate mark-license or registry fee. Independent laboratory testing is arranged and billed separately by a qualified independent laboratory.
Phase 1 focuses on water and suitable simple-liquid products, where testing methods are most defensible today.
WQI Plastic-Free Pathway Verification does not certify that a product contains zero plastic, microplastics or nanoplastics. It shows that the company is on a verified pathway toward plastic-free standards. Verification applies only to the reviewed products, submitted datasets, tested ranges, polymer panels, production or sampling periods, and supporting controls. WQI verification is not a California approval, government certification, or health or safety certification.
No single method works best for every situation. The right technique depends on the matrix being tested and the claim that needs support. For drinking water and simple liquids, vibrational spectroscopy methods, FTIR and Raman, are the most defensible options available today, with validated size ranges and published standard operating procedures. For complex matrices such as soil or biological tissue, the same methods require additional sample preparation steps and carry more caveats about what the result can support. For polymer mass quantification rather than particle counting, pyrolysis GC-MS is the appropriate tool, but it cannot support claims about particle counts, sizes, or morphology. Method selection functions as a claim decision rather than a technical default.
Testing drinking water or simple liquids for microplastics involves four stages. Sampling collects the water under contamination-controlled conditions. Sample preparation filters the water to concentrate particles, then uses chemical digestion to remove organic material that would interfere with identification. Separation uses density or other techniques to isolate plastic particles from remaining matrix material. Identification uses spectroscopic instruments to confirm polymer type, count particles, and measure sizes. Water is the matrix where current methods are most defensible, because low suspended-solids content reduces interference and validated standard operating procedures exist specifically for this matrix. Even so, results are bounded by the method’s detection floor, so particles below 20 or 50 µm, depending on the method, are not captured.
As explained earlier, “none detected” is a bounded statement rather than a guarantee of absence. The boundaries are the method’s detection floor, the polymer panel, and the lot tested. Understanding these limits separates a defensible claim from an overreach.
Both FTIR, meaning infrared spectroscopy, and Raman spectroscopy identify polymer type by analyzing how particles interact with light, and both are non-destructive, so the sample is preserved after analysis. Under the California State Water Board’s published standard operating procedures, infrared spectroscopy, SWB-MP1-rev1, is validated for particles greater than 50 µm through 5,000 µm, while Raman spectroscopy, SWB-MP2-rev1, is validated for particles greater than 20 µm through 5,000 µm. Raman therefore reaches smaller particles, but it is also more susceptible to fluorescence interference from organic matter in complex matrices, which can reduce its reliability in practice. Neither method reaches the 1–20 µm fraction, which sits outside both validated ranges.
Pyrolysis GC-MS cannot provide particle counts. It is a destructive technique that reports total polymer mass, for example how many micrograms of polyethylene are present per gram of sample, but it cannot attribute that mass to a specific particle count, a specific particle size, or a specific particle shape. A result from pyrolysis GC-MS and a result from FTIR or Raman are not directly comparable, because they measure different things. Pyrolysis GC-MS fits claims about polymer mass, while spectroscopic methods fit claims about particle counts or the presence of individual particles.
The 1–20 µm fraction is not validated under either California method, as noted earlier. The practical consequence is that no claim can rest on what happens in that size range under these frameworks.
Results vary substantially between laboratories. Instruments differ, detection floors differ, and capability varies not only between laboratories but within them depending on the instrument and method used. The Berber et al. review cited earlier found variability of one to three orders of magnitude between laboratories, and even drinking water shows similar interlaboratory spread. This variability explains why laboratory qualification, method documentation, and independent review of the full dataset matter as much as the result itself.
No laboratory today can confirm the complete absence of plastic across every particle size, polymer type, and production lot. Detection confirms what is present, while absence claims would require ruling out everything the method cannot see, including particles below the detection floor, polymers outside the tested panel, and production lots that were not sampled. A lab report reading “no microplastics detected” is therefore a bounded finding rather than proof that a product is free of plastic.
The decision framework in this guide has four steps in a fixed order. Matrix comes first, because the substance being tested determines which methods are defensible. Method comes second, because the instrument and protocol determine what the analysis can see. Detection floor comes third, because the lower size boundary of the validated method sets the boundary of every claim the data can support. Claim comes last, because public language must stay inside what the data actually licenses.
The central distinction in this field is that detection confirms presence but cannot confirm absence. A result of “none detected” is always bounded by the method’s floor, the polymer panel screened, and the lot tested. No method currently available can support a claim that a product is free of plastic, and any claim that implies otherwise stretches beyond what the science can carry.
Organizations that hold laboratory data and want to know what claim it can support share a specific need. They require an independent review of the method, reporting limits, blanks, scope, and data quality against a defined standard, which is the step that turns a laboratory report into a defensible public claim.
Research
Not all microplastics tests are equal. The Wellness Quality Institute breaks down FTIR, Raman, and more — so you choose the right method.
Read article
Brain microplastics found — but what does it mean? The Wellness Quality Institute breaks down the science and steps to reduce your exposure.
Read article
Microplastics are accumulating in human brain tissue. The Wellness Quality Institute breaks down what science confirms—and where the gaps remain.
Read article