
How to Test for Microplastics: Methods, Matrices & Claims
Match your microplastic test method to your matrix and claim. The Wellness Quality Institute guides you from detection to plastic-free verification.
Read articleNot all microplastics tests are equal. The Wellness Quality Institute breaks down FTIR, Raman, and more — so you choose the right method.
Written by: Scott Steveson, Specialist, Wellness Quality Institute
See how Plastic-Free Pathway Verification can support your next claim.
The most useful way to compare methods is by what they produce. Instrument specifications matter less than the output type.
Particle-counting and morphology methods, such as visual microscopy, stereomicroscopy, and fluorescence microscopy, output counts, size, color, and shape. A 2026 scoping review by Kusyk et al. at Poznan University of Medical Sciences, published in Molecules, notes that optical microscopy resolution generally limits detection to particles above approximately 20 µm. The review also explains that the technique cannot unequivocally identify polymer composition. Particles with similar appearance may be different polymers or even natural materials such as cellulose fibers. Visual identification alone never supports a defensible claim.
Spectroscopic identification methods, including micro-FTIR (Fourier transform infrared spectroscopy, which uses infrared light to identify the chemical makeup of materials) and micro-Raman (which uses laser light to identify chemical composition), output polymer identity per particle, plus size and morphology. These methods matter most for regulatory frameworks and are commonly used in drinking-water analysis.
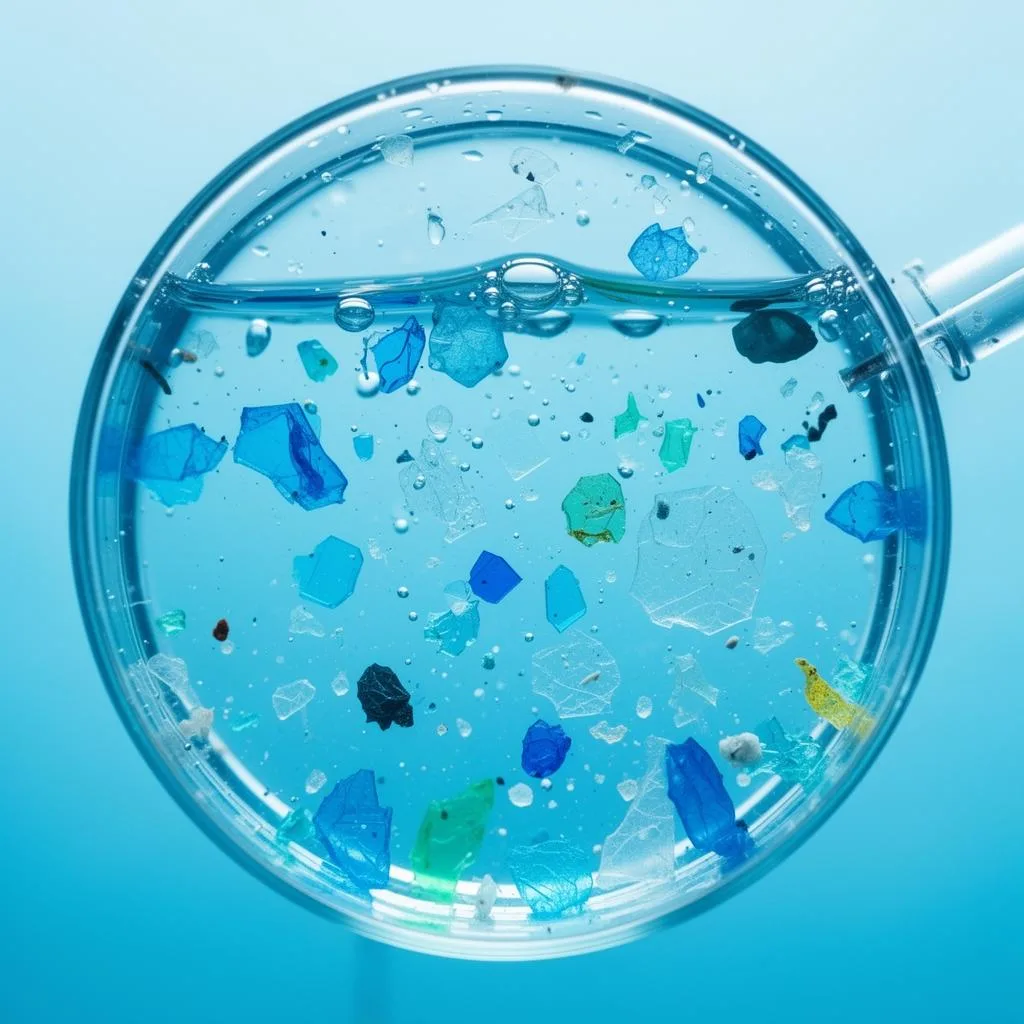
Mass-based methods, such as pyrolysis GC/MS (Py-GC/MS, which heats samples to break down polymers and identifies them by their chemical fragments) and thermal extraction desorption GC/MS (TED-GC/MS, a similar heat-based method for identifying polymer mass), output polymer mass concentration. Results typically appear in µg/L or mg/kg, without per-particle counts. As a 2026 narrative review by Alotaishan, Ahmad, and Sewify in Nutrition and Metabolic Insights states explicitly, particle-count and polymer-mass metrics “are not interchangeable.” That warning matters because a study reporting µg/L and a study reporting particles/L are measuring fundamentally different things. This difference is the hinge on which the rest of this comparison turns.
Both micro-FTIR and micro-Raman identify polymer chemistry at the individual-particle level. Their differences center on spatial resolution, matrix tolerance, and validated operating ranges.
One state water board has published two standard operating procedures that provide a stringent public reference framework for drinking-water microplastics testing. The infrared spectroscopy procedure applies to particles greater than 50 µm through 5,000 µm. The Raman spectroscopy procedure applies to particles greater than 20 µm through 5,000 µm. These ranges describe validated regulatory use, not the theoretical limits of the instruments.

Research settings push further. The 2026 Kusyk et al. Molecules scoping review reports that µ-FTIR covers a particle size range of roughly 10–20 µm with a limit of detection near 10–20 µm, while µ-Raman reaches down to roughly 1 µm with a limit of detection near 1 µm. A 2026 study by Jüngling et al. at the Technical University of Munich, published in Analytical and Bioanalytical Chemistry, demonstrated automated Raman microspectroscopy detecting particles down to 500 nm using optimized filter substrates and open-source software. These research limits are not the same as validated regulatory method ranges. They depend heavily on filter type, illumination settings, stage precision, and particle density, which vary between laboratories.
Raman’s smaller validated starting point suits smaller-particle targets. Its known limitation is fluorescence interference from natural organic matter, a constraint the 2026 Vega-Baudrit, Lopretti, and Orozco review in Molecules identifies as a major reliability constraint for nanoplastics analysis by Raman. FTIR handles more matrices reliably but carries a larger practical lower size boundary. Each method fits different goals.
The distinction between spectroscopy-based particle counting and Py-GC/MS or TED-GC/MS mass-based analysis is the most common source of error in brand claims about microplastics.
Particle-based methods answer how many particles appear, what size they are, and which polymers they contain. Mass-based methods answer how much polymer mass appears per unit of sample. As Bruker’s guide to microplastics analysis explains, mass-based methods are entirely blind to particle count, size distribution, and morphology. Because the sample is destroyed, it cannot be archived or reanalyzed. A single large plastic fragment gives the same mass result as a population of smaller particles that add up to equal mass.
Py-GC/MS microplastics analysis can be more sensitive to total polymer content and works well for detecting polymer mass in complex matrices. Mixing a µg/L result from Py-GC/MS with a particles/L result from micro-FTIR in a single claim creates a category error. The 2026 Alotaishan et al. review in Nutrition and Metabolic Insights attributes limited inter-study comparability directly to this heterogeneity in quantification approaches. That is why the authors did not perform a meta-analysis across studies using different output types.
“None detected” means none found above that instrument’s detection floor, for the polymers it screened, in the lot it tested. The phrase always describes a bounded result.
The number that matters most comes from one state’s drinking-water definition, which reaches down to greater than 1 nanometer and less than 5,000 micrometers across at least three dimensions. The best validated methods begin at 20 or 50 micrometers, which are thousands of times larger. The 1–20 µm fraction is not validated under either of the state water board’s methods, and everything below it remains beyond reliable commercial measurement. A 2026 review by Zhao et al. in Experimental and Therapeutic Medicine confirms that reliable detection of nanoplastics remains particularly problematic for particles below 100–200 nm in real environmental matrices.
No laboratory today can confirm the complete absence of plastic across every particle size, polymer type, and production lot. This reality reflects a hard technical limit that no amount of diligence can overcome. It comes from three sources. First, no method detects every particle size, and none reach reliably into the nanoplastic range. Second, no single test screens every polymer type across every product format. Third, a clean result on one production lot does not guarantee the next.
Method selection always depends on the smallest particle size that needs to be detected, the sample matrix, and the output required, such as counts, polymer identity, or mass. Because the detection floor depends on the method, choosing a method is really choosing which claims you can make. The table below maps method families to outputs and validated ranges, using one state water board’s SOPs as the common baseline.
| Method Family | Primary Output | Validated Range (State Water Board SOPs) | Best For |
|---|---|---|---|
| Visual Microscopy | Count, size, color, shape, no polymer ID | Practical floor ~20 µm; no state SOP validation | Initial sorting and large-particle screening; must be chemically confirmed |
| Micro-FTIR | Polymer identity per particle plus morphology | >50 µm through 5,000 µm (Infrared SOP) | Routine compliance, drinking water, regulatory alignment |
| Micro-Raman | Polymer identity per particle plus morphology | >20 µm through 5,000 µm (Raman SOP) | Smaller-particle targets and higher spatial resolution |
| Py-GC/MS, TED-GC/MS | Polymer mass concentration (µg/L, mg/kg) | Method-dependent; no state SOP validation | Total polymer mass and additive detection |
Choosing by matrix adds another layer of nuance.
Get your lab data reviewed against a published standard.
The instrument is only one part of the analytical workflow. Sample preparation often drives most of the variability between laboratories. A 2026 study by Silva et al. in Molecules, analyzing drinking water from Madeira Island using stereomicroscopy and micro-FTIR, found that procedural blanks can force conservative method detection limits. In practice, sample preparation and contamination control can set the practical lower bound of detection as much as the instrument itself.

A rigorous inter-laboratory study cited in a 2026 review at PMC found procedural blanks containing 7–511 microparticles per sample. Approximately 20% of published microplastic studies reported no procedural blanks at all. These findings show how blank handling can distort published concentration estimates.
The contested nanoplastics blank-control episode illustrates the stakes directly. A 2024 PNAS study by Qian et al. reported roughly 240,000 plastic particles per liter of bottled water, most of them nanoplastics. A subsequent PNAS commentary found the study’s procedural blanks appeared contaminated and its quality control inadequate. The critique turns entirely on blank controls, the same contamination controls that any rigorous method review must assess. The finding and the critique belong together, because neither is complete without the other.
The SCCWRP Technical Report 1410.B (Thornton Hampton et al., August 2026), a standard operating procedure for ambient water sampling, states plainly that background contamination from airborne particles cannot be eliminated. Contamination characterization, rather than elimination, becomes the operative quality-assurance goal. The report requires at least one field blank per sampling event, with results reported alongside sample results, and flags all samples from a sampling event if the field blank particle count exceeds the Minimum Reporting Level.
Even a rigorous method with tight blank controls produces only a bounded result. The next question is what that result can support once it leaves the laboratory and becomes a public claim. A lab report alone does not become a defensible market claim. Self-reported results are often treated as marketing regardless of how rigorous the underlying testing was. A “no microplastics detected” finding is bounded entirely by the instrument’s detection floor. It means none found above 50 µm, or 20 µm for Raman, using that method on that lot.
The Wellness Quality Institute (WQI) is an independent verification body that reviews a company’s existing third-party laboratory data on plastic and microplastic content against a defined standard. That standard is its Plastic-Free Pathway Verification program, governed by WQI-CS-01 and aligned with one state water board’s drinking-water microplastics reference framework. One state serves as a technical reference point, not a geographic boundary. Verification is available to US companies nationally. That state did not create, approve, authorize, or endorse the Wellness Quality Institute or its standard.
The Wellness Quality Institute does not run laboratory tests and does not certify that any product is free of plastic. It reviews the dataset, method, product scope, and supporting controls. If the review succeeds, it issues Standard Met, which carries a verification decision, a scope-locked logo license, a public registry listing, and approved claim language. If it does not, it issues Standard Not Met, a private outcome never described as a failed product and one that can be resubmitted with updated information. A single assessment fee covers review, verification decision, and registry listing. Independent laboratory testing is arranged and billed separately by a qualified independent laboratory.
WQI Plastic-Free Pathway Verification does not certify that a product contains zero plastic, microplastics, or nanoplastics. It shows that the company is on a verified pathway toward plastic-free standards. Verification applies only to the reviewed products, submitted datasets, tested ranges, polymer panels, production or sampling periods, and supporting controls. WQI verification is not a state approval, government certification, or health or safety certification.
Request an independent review of your existing lab data.
Because the detection floor bounds every claim, the questions below help you pressure-test a lab report before it becomes a marketing statement. Use them to determine what the data can actually support.
There is no single best method. The right choice depends on the smallest particle size that needs to be detected, the sample matrix, and the output required. Micro-FTIR and micro-Raman identify individual polymer particles and are most aligned with regulatory drinking-water frameworks. Py-GC/MS and TED-GC/MS quantify total polymer mass but cannot report particle counts or morphology. Visual microscopy provides count and size data but cannot chemically identify polymers and must always be confirmed by spectroscopy. Choosing a method without knowing what output it produces, and what question that output answers, remains the most common error in microplastics analysis.
Neither method works best in every situation. Under one state water board’s standard operating procedures, infrared spectroscopy is validated for particles greater than 50 µm through 5,000 µm, while Raman spectroscopy is validated for particles greater than 20 µm through 5,000 µm. Raman’s smaller validated starting point makes it better suited for smaller-particle targets, but it is more susceptible to fluorescence interference from natural organic matter and certain plastic additives. FTIR handles more matrices reliably but has a larger practical lower size boundary. The right choice depends on the matrix, the target particle size, and the regulatory framework being applied.
These units measure fundamentally different things. Particle-based methods, such as micro-FTIR and micro-Raman, count and chemically identify individual particles, reporting results as particles per liter with size and polymer information attached. Mass-based methods, such as Py-GC/MS and TED-GC/MS, thermally destroy the sample and quantify total polymer mass, reporting results in µg/L or mg/kg with no particle count or morphology information. A single large plastic fragment and a population of smaller particles adding up to equal mass produce the same mass result but very different count results. Combining the two in a single claim, or comparing studies that used different output types, creates a methodological error that produces misleading conclusions.
“None detected” means none found above that instrument’s detection floor, for the polymers it screened, in the lot it tested. The phrase always describes a bounded statement. A method validated above 50 µm cannot see anything smaller, so “none detected” can coexist with particles being present below that size. The detection floor is the ceiling on the claim. Any market assertion that goes beyond what the method’s detection floor can support is not substantiated by the data, regardless of how the result is phrased.
No. No laboratory today can confirm the complete absence of plastic across every particle size, polymer type, and production lot. This is the same hard technical limit described earlier, where no method covers every particle size, polymer type, or production lot. As noted earlier, the regulatory definition reaches down to 1 nanometer while validated methods begin at 20 or 50 micrometers. The gap between what regulation defines and what any method can detect is the defining feature of this field, so any claim of total absence goes beyond what current science can support.
See how independent verification can support a defensible claim.
The detection floor is the ceiling on every microplastics claim. Method choice becomes a decision about what can be defensibly said. Particle-based and mass-based outputs remain non-interchangeable. The 1–20 µm fraction is not validated under either of the state water board’s methods. “None detected” always describes a bounded statement, and no laboratory can certify the complete absence of plastic in any product.
For further technical diligence, credible primary sources include the state water board’s SWB-MP1-rev1 and SWB-MP2-rev1 SOPs, ISO 24187:2023, ISO 16094-2:2025, WHO’s Microplastics in Drinking-Water (2019), and the OECD’s Global Plastics Outlook.
For companies that already hold laboratory data and need to know whether it can support a claim, and what that claim can honestly say, the Wellness Quality Institute’s Plastic-Free Pathway Verification provides independent review against a defined, published standard. That review converts a laboratory report into a position a brand can stand behind.
Start a Plastic-Free Pathway Verification review of your current data.
Research

Match your microplastic test method to your matrix and claim. The Wellness Quality Institute guides you from detection to plastic-free verification.
Read article
Brain microplastics found — but what does it mean? The Wellness Quality Institute breaks down the science and steps to reduce your exposure.
Read article
Microplastics are accumulating in human brain tissue. The Wellness Quality Institute breaks down what science confirms—and where the gaps remain.
Read article