
Microplastics Activities That Teach Water Science Honestly
The Wellness Quality Institute shares 12 activities teaching real microplastics science for Water Quality Month — honest, evidence-based education.
Read articleCan labs prove "zero plastic" in water? The Wellness Quality Institute explains what microplastics data really shows and how brands stay defensible.

National Water Quality Month traces its formal origins to 2005, when the Environmental Protection Agency and the United Nations designated August as the month to focus national attention on water quality. August is peak season for recreational water use, outdoor irrigation, and household water consumption, so water quality feels immediate and personal.
The legislative foundation runs deeper. The Clean Water Act of 1972 made it unlawful to discharge any pollutant from a point source into navigable waters without a permit and maintained existing requirements to set surface water quality standards. The Safe Drinking Water Act of 1974 extended protections to groundwater and public water systems. National Water Quality Month keeps those legislative achievements visible and reminds the public that protecting water quality requires ongoing effort, not regulation alone.
As the Beaumont-Cherry Valley Water District notes, “protecting water quality is a shared responsibility. Small actions taken by each of us, at home and throughout our community, help preserve our local water resources for future generations.”
Water quality is not a single measurement. It is a profile built from multiple parameters that together show whether water is safe and ecologically sound. Understanding what is measured makes the absence of microplastics from this list even more striking.
These five indicators address biological, chemical, and physical dimensions of water quality. They do not address microplastic particle content, which no standard regulatory monitoring framework currently captures at scale. That gap drives the rest of this article.
Microplastics are solid plastic particles smaller than 5 millimeters. They include fragments, fibers, films, and beads that keep their chemical identity as polymers, the molecular chains that make plastic behave like plastic, long after they stop resembling the objects they came from. Nanoplastics are a subset smaller than 1 micrometer, roughly a thousandth of a millimeter, and they remain beyond the reliable reach of most commercial laboratory methods.
Sources divide into two categories. Primary microplastics are manufactured small, such as microbeads in personal-care products and industrial pellets used in manufacturing. Secondary microplastics form when ordinary plastic objects such as bottles, packaging, synthetic textiles, agricultural films, and tire rubber break down under sunlight, heat, and mechanical stress.
The scale of the problem reflects production volume. Global plastics production roughly doubled from 234 million tonnes in 2000 to approximately 460 million tonnes in 2019, according to the OECD’s Global Plastics Outlook, and is projected to rise a further 70% by 2040 on current trajectories. Everything produced eventually degrades somewhere.
Particles reach drinking water through multiple simultaneous routes:
Detection has followed production. A peer-reviewed 2018 study by Kosuth, Mason, and Wattenberg in PLOS ONE found anthropogenic particles in 81% of 159 tap water samples sourced across five continents. A separate 2018 study led by Sherri Mason at the State University of New York at Fredonia, published in Frontiers in Chemistry, found microplastic contamination in 93% of 259 bottled water samples across eleven brands, at roughly twice the particle concentration of tap water, with polypropylene, the material used in bottle caps, as the most commonly identified polymer.

The World Health Organization’s 2019 assessment, Microplastics in Drinking-Water, found low concern for health risk on the limited evidence available, while stressing that the conclusion rests on incomplete information and that more research is urgently needed. That phrase, incomplete information, frames the measurement challenges that follow.
See how WQI verification addresses these measurement limitations
California’s State Water Board has published one of the most stringent public reference frameworks for microplastics in drinking water currently available in the United States. Its definition, reaching from 1 nanometer to 5 millimeters, is deliberately broad and intended to capture the full range of plastic particles that may be present. Other states and organizations may choose to adopt similar frameworks as an example.
Two analytical methods accompany that definition, each with its own validated detection range:
The regulatory definition reaches down to 1 nanometer. The best validated methods begin at 20 or 50 micrometers, which are thousands of times larger. The fraction between 1 and 20 micrometers is not validated under either method. Everything below 1 micrometer, the nanoplastic range, is currently beyond reliable commercial measurement.
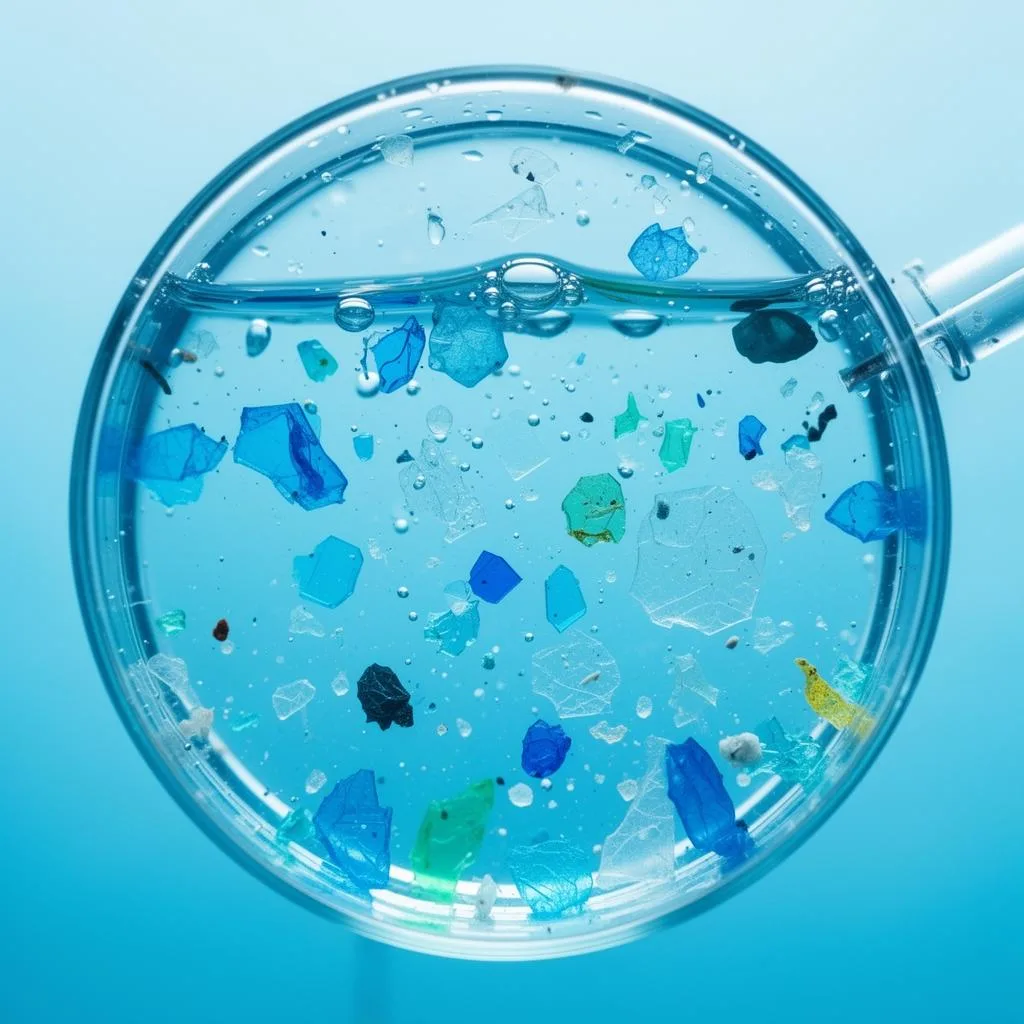
This gap reflects a hard technical limit rather than a lack of laboratory diligence. A 2026 PRISMA-guided review by Vega-Baudrit, Lopretti, and Orozco in Molecules, examining 22 studies, concludes that nanoplastics in drinking water remain analytically immature because environmentally relevant concentrations are low, particle chemistries are heterogeneous, natural colloids and treatment residuals interfere with measurement, and no single method simultaneously resolves size, shape, polymer identity, and mass concentration.
The practical consequence is straightforward. A water product tested using the best available validated methods has been examined for particles above the relevant detection floors, using a defined polymer panel, on a specific production lot. Everything outside those boundaries, including smaller particles, untested polymers, and other lots, remains unexamined. That picture reflects the current state of the science.
“None detected” is a bounded statement, not a guarantee. It means no particles were found above this instrument’s detection floor, for the polymers it screened, in the lot it tested. Three distinct limits constrain every such result:
Blank controls, which are samples processed through the entire analytical workflow without any product, are essential to interpreting any result because they measure background contamination introduced by the laboratory itself. A 2018 quality assessment framework by Hermsen, Mintenig, Besseling, and Koelmans, applied to existing microplastic ingestion studies, found the studies scored an average of 8.0 out of 20 points for completeness of information and 0 for reliability, with blank controls among the most commonly missing elements.
A laboratory report that does not document its detection floor, polymer panel, blank results, and sampling scope cannot be read as evidence of absence. It can only be read as evidence of what was and was not examined.
Many companies already hold genuinely useful laboratory data. They have commissioned independent testing, spent real money on it, and acted on the results. They often lack a trusted way to use those results publicly.
A lab report alone does not become a defensible market claim. Self-reported results carry less weight than independently reviewed data, and without independent review, even rigorous data is perceived as marketing. Independent review of microplastics data evaluates whether particle identity was confirmed via validated methods, contamination was ruled out through strong procedural blanks, realistic exposure doses were used, relevant particle types and sizes were tested, and conclusions match the actual data rather than overstating detection.
This is the gap the Wellness Quality Institute (WQI) was built to close. The Wellness Quality Institute is an independent verification body that reviews companies’ existing third-party laboratory data on plastic and microplastic content against a defined standard, so brands can substantiate real progress toward plastic-free standards instead of making impossible zero-plastic claims.
The Wellness Quality Institute’s core program, Plastic-Free Pathway Verification (PFPV), governed by the standard WQI-CS-01, reviews a company’s existing independent laboratory dataset, testing methodology, product scope, and supporting controls against defined criteria focused on particle size and polymer type. These criteria align with the California State Water Board’s drinking-water microplastics reference framework as a technical reference point. California is not a geographic boundary, and verification is available to U.S. companies nationally. California did not create, approve, authorize, or endorse the Wellness Quality Institute or its standard.
Every review produces one of two outcomes. Standard Met carries a verification decision, a scope-locked license to use the WQI logo, a public registry listing, and approved claim language. Standard Not Met is a private outcome that is never described as a failed product and can be resubmitted with updated information.
Verification is locked to the reviewed product, dataset, tested particle-size range, polymer panel, and production period. No company-wide or product-line claim may be extended from a single dataset. The claim becomes checkable rather than simply assertable.
The Wellness Quality Institute’s Plastic-Free Pathway Verification does not certify that a product contains zero plastic, microplastics or nanoplastics. It shows that the company is on a verified pathway toward plastic-free standards. Verification applies only to the reviewed products, submitted datasets, tested ranges, polymer panels, production or sampling periods, and supporting controls. The Wellness Quality Institute verification is not a California approval, government certification, or health or safety certification.
Start your Plastic-Free Pathway Verification review
National Water Quality Month offers a useful moment to take stock of what individuals and organizations can do within the constraints of current science. The goal is informed reduction, not an unachievable purity standard.
For consumers:
For brands and sustainability leads:
National Water Quality Month is an annual observance held each August in the United States. It was established in 2005 to promote awareness of water conservation and protection, building on the legislative foundations of the Clean Water Act of 1972 and the Safe Drinking Water Act of 1974. The observance encourages individuals, communities, water agencies, and businesses to take practical steps toward protecting the nation’s water sources for current and future generations.
No laboratory test can currently prove total absence of plastic. Current laboratory technology cannot confirm the complete absence of plastic across every particle size, polymer type, and production lot. The best validated methods for drinking water, infrared spectroscopy and Raman spectroscopy, begin at 50 and 20 micrometers respectively, which leaves the 1–20 micrometer fraction unvalidated and the nanoplastic range, below 1 micrometer, effectively beyond reliable commercial measurement. A “none detected” result means no particles were found above the instrument’s detection floor, for the polymers it screened, in the lot it tested. It does not mean no plastic is present. Any claim of total absence is a claim the science cannot currently carry.
The Wellness Quality Institute’s Plastic-Free Pathway Verification mark means that a company’s laboratory dataset has been independently reviewed against a defined standard, and that the data supports genuine progress toward plastic-free production within the tested particle-size range, polymer panel, and production period reviewed. It does not mean the product is free of plastic. “Pathway” is the load-bearing word, because it signals progress along a route rather than arrival at a destination. The program is explicitly built around the recognition that the destination cannot currently be reached, or even fully measured. As noted earlier, WQI verification is independent, not a government or California state approval.
A laboratory report tells you what a laboratory found. It does not, on its own, tell the market what that finding supports or reassure a skeptical buyer that the interpretation is independent. Independent review assesses whether the method suited the product matrix, whether reporting limits are adequate, whether blank controls were run, what the tested particle-size range actually covers, and what claim the data can honestly carry. Many companies discover their existing data supports a narrower, or a stronger, claim than they assumed. Without that review, even rigorous data is perceived as marketing because the company grading its own homework has an obvious interest in the grade.
The five indicators most consistently used across regulatory and public health frameworks are pH, which measures acidity or alkalinity, dissolved oxygen, which reflects the oxygen available to aquatic life, turbidity, which reflects water clarity and suspended particles, nutrients such as nitrogen and phosphorus, which drive algal blooms when present in excess, and pathogens or microbial indicators such as E. coli and Enterococci, which signal fecal contamination. These parameters address biological, chemical, and physical dimensions of water quality. Microplastic particle content is not currently captured in standard regulatory monitoring frameworks, which is why the measurement gap discussed in this article remains unaddressed at the policy level.
National Water Quality Month 2026 arrives at a moment when consumer awareness of microplastics in drinking water is rising faster than the measurement infrastructure needed to address it honestly. The five standard indicators of water quality have decades of regulatory history behind them. Microplastics do not, and the distance between what the California regulatory definition contemplates, particles down to 1 nanometer, and what the best validated methods can reliably detect, particles above 20 or 50 micrometers, is thousands of times larger than most consumers or brands realize.
That gap calls for precision rather than alarm. Brands that hold genuine laboratory data and want to use it responsibly need a way to convert raw results into scope-limited, independently reviewed claims. Those claims must stay inside what the evidence actually supports and hold up when a retailer, journalist, or litigant examines them.
The Wellness Quality Institute exists to provide exactly that service. A single assessment fee covers review, verification decision, and registry listing, with no separate mark-license or registry fee. Independent laboratory testing is arranged and billed separately by a qualified independent laboratory. Payment of the assessment fee does not guarantee a verification decision.
The strongest claim a brand can make in this environment is not the broadest one. It is the one it can substantiate.
Water Quality

The Wellness Quality Institute shares 12 activities teaching real microplastics science for Water Quality Month — honest, evidence-based education.
Read article
The Wellness Quality Institute helps brands turn microplastics lab data into accurate, defensible claims. Avoid costly mistakes — get expert help.
Read article
August is National Water Quality Month. The Wellness Quality Institute helps brands verify plastic-free claims—protect your water and your customers.
Read article