
Home Water Testing: City, Well Water & Microplastics
Learn how to test city or well water, read results, and spot microplastics. The Wellness Quality Institute helps brands verify plastic-related claims.
Read articleThe Wellness Quality Institute helps brands make verified, defensible microplastic claims. Understand the evidence, the gaps, and get certified today.

Written by: Scott Steveson, Specialist, Wellness Quality Institute | Last updated: August 28, 2026
Microplastics are consistently detected in municipal tap water across peer-reviewed research, although concentrations vary by location, treatment system, and test method.

A 2018 study by Kosuth, Mason, and Wattenberg in PLOS ONE found anthropogenic particles, meaning particles from human activity, in 81% of 159 tap water samples from five continents. A separate 2018 study led by Sherri Mason at the State University of New York at Fredonia, published in Frontiers in Chemistry, found microplastic contamination in 93% of 259 bottled water samples across eleven brands, at roughly twice the particle concentration found in tap water. The most common polymer in that bottled water study was polypropylene, the plastic used in many bottle caps, which points to packaging as a key contamination source.
Detection proves that microplastics are present. It cannot prove that they are absent. Finding a particle requires isolating it and confirming that it is a plastic polymer. Proving that no plastic is present would require ruling out everything the method cannot see, including particles below the detection limit and polymers outside the test panel. Two facts hold at once. Most tested water samples contain detectable microplastics, and no laboratory can credibly certify that any product is completely free of them.
The proportional response to microplastics in drinking water is steady concern, not panic. The WHO 2019 assessment examined three possible hazard routes, which were the physical particles, the chemical additives in plastics, and micro-organisms that may attach to particles. It found low concern for each route based on the limited evidence available. The WHO’s 2022 follow-up reported that data remain insufficient for a full quantitative risk assessment and found little evidence that micro- and nanoplastics have adverse effects in humans, while stressing that the evidence base is still thin.
The research on plastic additives is far more developed than the research on physical microplastic particles. The chemicals used to make plastics flexible or durable, such as phthalates and bisphenols, have been studied for decades. Phthalates and bisphenols are well-established endocrine-disrupting compounds, supported by animal studies, clinical observation, and population-level research. The particles themselves are a newer and less settled question. One issue concerns what plastics are made with. The other concerns the fragments they break into. Strong evidence about additives does not automatically prove that microplastic particles cause the same harms.
On the particle side, recent human tissue studies raise serious but still early questions. A 2025 study led by Alexander Nihart in Nature Medicine reported microplastic and nanoplastic accumulation in human brain, liver, and kidney tissue, with the highest concentrations in brain samples. The particles were predominantly polyethylene, present mainly as nanoscale fragments. These findings matter, yet they come from a limited sample. A later commentary in Nature Medicine raised concerns about contamination controls and method validation. A rapid systematic review of microplastic exposure effects identifies oxidative stress and systemic inflammation as the two most consistently discussed potential mechanisms. These studies confirm that particles can reach human tissues and justify close attention. They do not yet prove causation or support alarm.
The U.S. Food and Drug Administration stated in 2024 that current scientific evidence does not show that levels of microplastics or nanoplastics detected in foods pose a risk to human health, and that presence alone does not equal risk. In April 2026, the EPA placed microplastics on its draft Sixth Contaminant Candidate List. That move signals that the topic needs further evaluation. It does not set a risk threshold or create a regulation.
Understanding the health implications first requires understanding what current tools can measure. The most important fact about microplastics in drinking water is not what has been found. It is what current methods still cannot see.
Some regulatory definitions reach down to 1 nanometer, which is one billionth of a meter. The best validated analytical methods in commercial use today typically start at 20 or 50 micrometers, which are thousands of times larger. Everything between 1 nanometer and 20 micrometers is, in practice, invisible to routine commercial testing.
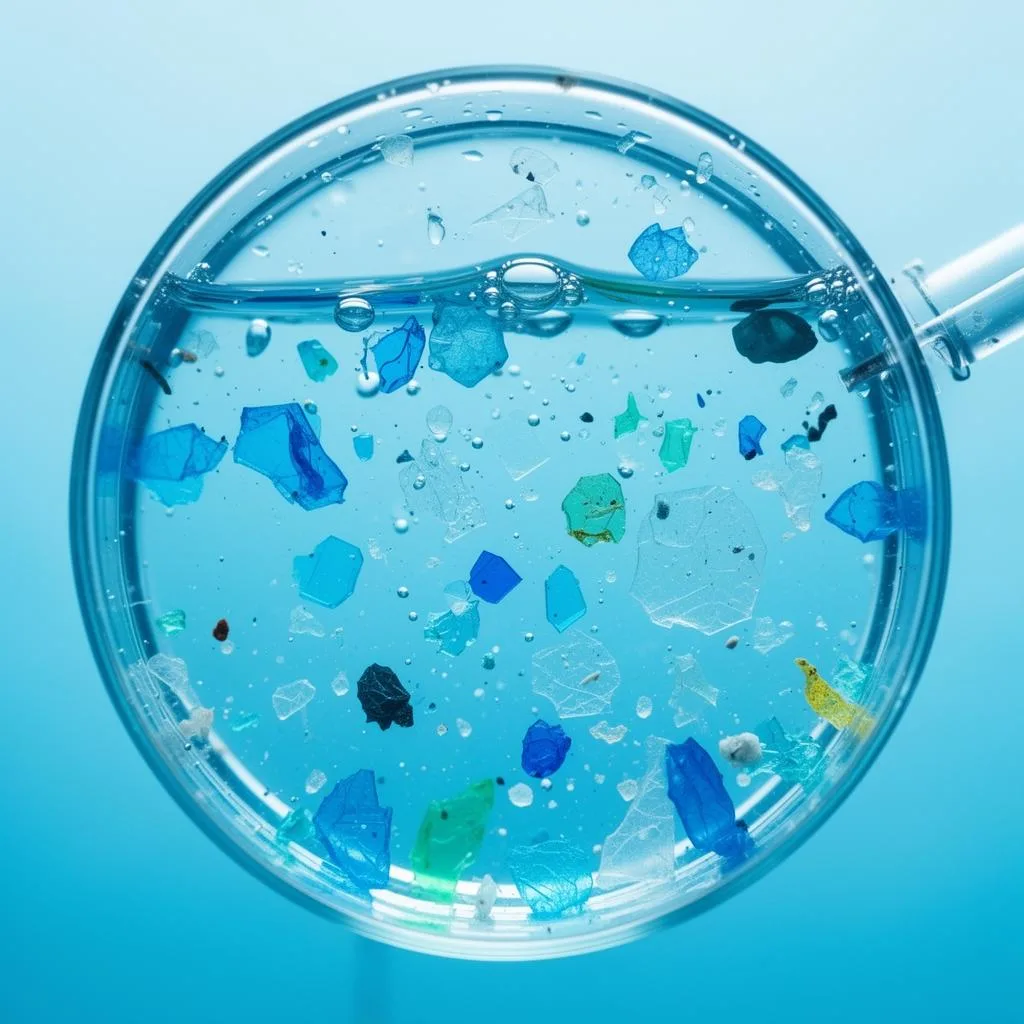
The table below illustrates this gap using one regulatory framework as a reference point. This framework appears here as a technical example of a stringent public reference, not as a rule that applies to every company or state.
| Reference point | Raman spectroscopy (SWB-MP2-rev1) | Infrared spectroscopy (SWB-MP1-rev1) | Unvalidated fraction |
|---|---|---|---|
| One regulatory definition: solid polymeric material, at least three dimensions >1 nm and <5,000 µm | Validated range: >20 µm through 5,000 µm | Validated range: >50 µm through 5,000 µm | 1 nm to 20 µm, not validated under either method, and not reliably measurable by routine commercial labs |
This gap has a direct consequence. A laboratory result that reads “no microplastics detected” means that none were found above that instrument’s detection floor, for the polymers it screened, in the specific lot it tested. It does not mean that no microplastics are present at all. The EPA notes that the wide range of particle sizes, densities, and compositions means no single method can characterize the full variety of micro- and nanoplastic particles. A 2025 review in Environmental Science: Nano reaches a similar conclusion, stating that no single technique can fully characterize micro- and nanoplastics across all sizes and compositions.
This limitation reflects the current state of technology, not a lack of effort. It is a hard technical boundary and the core reason no product can be accurately described as plastic-free.
Many companies already hold valuable laboratory data. They have paid independent labs, received detailed reports, and made internal changes based on those findings. What they often lack is a trusted, independent way to translate that data into clear, supportable claims in the market.
A lab report by itself does not create a defensible claim. Self-published results carry less weight than independently reviewed data. Without outside review, even careful testing can sound like marketing copy. A brand might hold a report that reads “no microplastics detected” without realizing that the finding is limited by the method’s detection floor. In practice, that phrase means none found above a specific size, using a specific method, on a specific lot, not a guarantee that no plastic is present.
The Wellness Quality Institute introduces itself as an independent verification body that reviews a company’s existing third-party laboratory data on plastic and microplastic content against a defined standard. After that first mention, the Wellness Quality Institute is referred to as WQI. WQI helps brands support real progress toward plastic-free standards instead of making impossible zero-plastic promises. WQI’s core program, Plastic-Free Pathway Verification (PFPV), governed by the standard WQI-CS-01, independently reviews a company’s laboratory dataset, test methods, product scope, and supporting controls. The criteria focus on particle size and polymer type. WQI aligns its review criteria with one regulatory drinking-water microplastics framework as a technical anchor because that framework is a stringent and credible public reference, not because it authorizes or endorses the program.
Every review produces one of two outcomes. “Standard Met” includes a verification decision, a scope-specific license to use the WQI mark, a public registry listing, and approved claim language. “Standard Not Met” remains private, is never described as a failed product, and can be resubmitted with updated information. This scope-specific approach exists because verification applies only to what was actually tested, which includes the reviewed product, dataset, tested particle-size range, polymer panel, and production period. That is why no company-wide or product-line claim can be stretched from a single dataset. The verification is tied to the submitted evidence, not to the entire brand.
The approved mark, “WQI Plastic-Free Pathway Verified,” is designed to be the strongest claim current science can support, and no stronger. The word “Pathway” signals progress along a route rather than arrival at a destination that current measurement cannot confirm. Verification does not function as a government approval, a government certification, or a health or safety certification.
A single assessment fee covers the review, verification decision, and registry listing. There is no separate fee for using the mark or for the registry entry. Independent laboratory testing is arranged and billed by a qualified independent lab. Paying the assessment fee does not guarantee that WQI will issue a verification decision.
If you already have third-party lab reports, WQI can help you turn that data into a defensible market position backed by independent review.
Stay informed, not frightened. Microplastics appear widely in tap water studies, and researchers have detected plastic particles in human tissue. As mentioned earlier, the WHO’s 2019 assessment found no indication that current levels in drinking water pose a health risk, while stressing that evidence remains limited and more research is needed. This topic deserves attention and ongoing learning, but it is not a reason to panic. You can make informed choices without fear.
Scientists do not yet have a definitive answer. Laboratory and animal studies point to possible mechanisms, with inflammation and oxidative stress appearing most often. The chemical additives in some plastics, such as phthalates and bisphenols, are well-established endocrine disruptors. Detecting a particle in the body, however, is not the same as proving that it causes harm. Much of the research uses small samples, and some studies face methodological challenges. Claims of certainty in either direction move ahead of the evidence. As of 2026, there are no agreed exposure thresholds or clinical cutoffs for internal micro- and nanoplastic burdens.
That phrase means less than many people assume. As explained in the measurement section, “none detected” is limited by the method’s detection floor. It means none were found above that threshold, for the polymers screened, in the lot tested. A method that starts at 50 micrometers cannot see anything smaller, so “none detected” can coexist with particles below that size. This is why independent review of the method and scope matters as much as the headline result, and why no honest report can promise that a product is plastic-free.
No federal maximum contaminant level or treatment technique currently exists for microplastics in drinking water. In April 2026, the EPA placed microplastics on its draft Sixth Contaminant Candidate List, which signals further evaluation under the Safe Drinking Water Act. Inclusion on that list does not create regulation and does not impose requirements on public water systems. The EPA also left microplastics out of its proposed Sixth Unregulated Contaminant Monitoring Rule because no validated, standardized EPA analytical method for microplastics in drinking water yet exists. Several states introduced or advanced their own frameworks in 2025 and 2026.
“Plastic-free” sounds stronger than current science can support. No laboratory today can confirm the complete absence of plastic across every particle size, polymer type, and production lot, because validated detection methods do not cover the full size range in regulatory definitions. A “plastic-free” claim therefore cannot be proven and increasingly carries legal and reputational risk. A more defensible approach is a verified pathway claim. That type of claim ties to a specific reviewed dataset, a defined particle-size range, and a specific production period, and it clearly states what it covers and what it does not.
The evidence on microplastics in municipal drinking water points in a consistent direction. Microplastics are present and detectable, and the health implications at current exposure levels remain unsettled. The WHO’s 2019 assessment found no indication of risk at current levels. Later research has found plastic particles in human tissue and raised questions about possible mechanisms of harm. Neither alarm nor dismissal fits the current evidence. The appropriate stance is informed awareness.
The measurement gap deepens this uncertainty. As described earlier, regulatory definitions reach to 1 nanometer, while the best validated methods begin at 20 or 50 micrometers. Everything below that floor remains invisible to routine commercial testing. That gap reflects a technical limit and explains why no product can be honestly described as plastic-free today.
For brands, this situation creates a clear challenge. Real progress is possible and worth communicating, yet a lab report stored in a folder does not equal a defensible claim. Independent review turns real data into a position a brand can stand behind, with approved language, a public registry entry, and a scope that clearly explains what was tested and what was not.
If you are ready to convert your laboratory data into a defensible market claim, WQI’s verification process provides the independent review that turns testing into trust.
The OECD’s Global Plastics Outlook projects global plastics production to rise about 70% by 2040 on current trajectories. The measurement tools, standards, and claim language needed for a serious public conversation about plastic content in consumer goods are still under construction. The Wellness Quality Institute exists to bridge the gap between what science currently supports and what brands need to say, and to give both consumers and honest brands a trustworthy footing in a conversation that often lacks one.
Ready to give your testing data the independent credibility it needs? Start the Plastic-Free Pathway Verification process with the Wellness Quality Institute.
Water Quality

Learn how to test city or well water, read results, and spot microplastics. The Wellness Quality Institute helps brands verify plastic-related claims.
Read article
The Wellness Quality Institute explains California's microplastics rules—MCLs, notification levels & basin plans—to keep your claims defensible.
Read article
The Wellness Quality Institute helps brands verify water quality claims with independent testing. Build consumer trust with solid evidence. Start now.
Read article