
Home Water Testing: City, Well Water & Microplastics
Learn how to test city or well water, read results, and spot microplastics. The Wellness Quality Institute helps brands verify plastic-related claims.
Read articleThe Wellness Quality Institute explains how Raman spectroscopy identifies microplastics and what labs need for defensible results. Learn more.

Written by: Scott Steveson, Specialist
The California State Water Board’s standard operating procedure SWB-MP2-rev1 validates Raman spectroscopy for particles greater than 20 µm through 5,000 µm. Laboratories can defensibly report only within that range in a routine verification context. The 1–20 µm fraction is not validated under this method, and everything below 1 µm, the nanoplastic range, remains beyond reliable commercial measurement for most workflows.
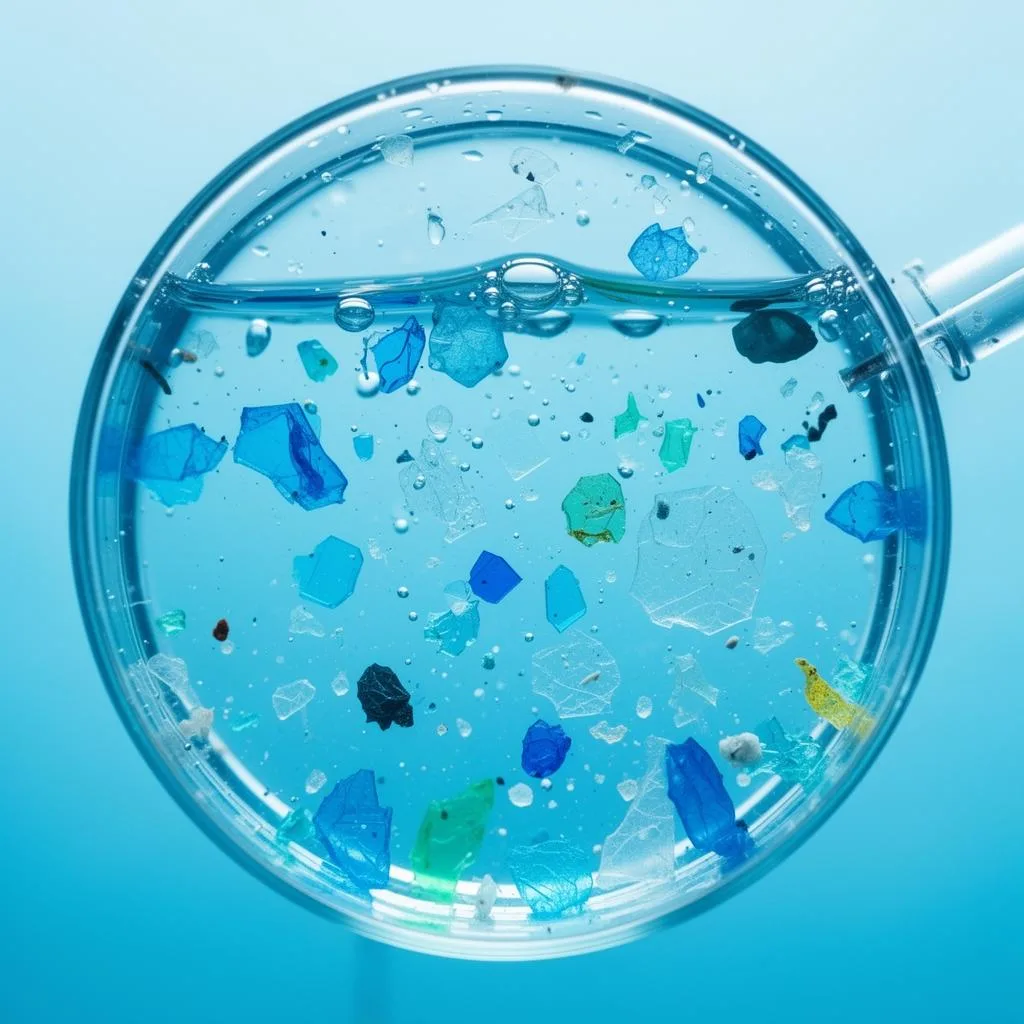
Research laboratories working under highly optimized conditions have pushed detection limits further. A 2026 study by Jüngling et al. in Analytical and Bioanalytical Chemistry demonstrated automated Raman microspectroscopy capable of detecting particles down to 500 nm. A 2026 PRISMA-guided review reports Raman imaging of particles down to 100 nm under carefully controlled laboratory conditions.
Those research figures do not replace the validated routine range. Recovery rates below 70 percent, strict substrate requirements, and strong dependence on the sample matrix mean sub-micron research results do not translate directly into defensible commercial claims. A 2026 Frontiers in Environmental Science review warns that detection floors established by standards such as ASTM D8333 (20–5,000 µm) must not be confused with actual absence of particles below the cutoff.
The practical takeaway is clear. A result of “none detected” using SWB-MP2-rev1 means none found above 20 µm using that method on that lot. It does not describe what exists below that floor.
Raman spectroscopy works through inelastic scattering. When a laser strikes a molecule, most photons bounce back at the same energy, which is elastic scattering. A small fraction interact with the molecule’s chemical bonds and return at a shifted energy. That energy shift, called the Raman shift, is unique to each polymer’s molecular structure and functions as a chemical fingerprint. Approximately 1 in 107 photons generates a Raman response, so the signal is inherently weak and interference management becomes critical.
Two laser wavelengths dominate routine microplastics work. A 785 nm near-infrared laser reduces fluorescence interference from pigments and organic matter, the most common sources of signal contamination, but sacrifices some spatial resolution. A 532 nm green laser delivers higher spatial resolution, with a theoretical spot size of approximately 300 nm using a high-numerical-aperture objective, but excites more fluorescence from colored or degraded samples. A 2026 study using confocal Raman microscopy on human blood samples used a 785 nm laser specifically to reduce dye-related resonance interference in biological matrices. The choice of laser wavelength therefore represents a deliberate trade-off that must be documented in any dataset submitted for independent review.
That trade-off exists because fluorescence is the primary practical limitation of Raman spectroscopy for microplastics. When a laser excites fluorescent molecules such as pigments, organic matter, weathering byproducts, or certain plastic additives, the resulting broad emission can overwhelm the narrow Raman peaks entirely. At that point polymer identification becomes unreliable or impossible.
Common sources of fluorescence interference in microplastics work include:
Laboratories use several documented mitigation strategies:
A laboratory report that does not document which mitigation strategies were applied leaves readers unable to judge whether a “none detected” result reflects the sample or a masked signal.
Reliable Raman results depend heavily on what happens before the laser fires. Standard preparation for liquid matrices involves digestion to remove organic matter, filtration onto a compatible substrate, and a documented chain of custody from sample collection through analysis.
Jüngling et al. (2026) describe a contamination-control protocol that includes cleaning all glassware with soap, filtered Milli-Q water, and ethanol, followed by wrapping in aluminum foil and heating at 500°C for six hours. All filtrations occur in a flow box, and blanks are prepared using the identical procedure. A 2026 blood-matrix study pre-characterized unavoidable plastic laboratory items such as nitrile gloves, butterfly needles, and Vacutainer caps by confocal Raman spectroscopy. That reference library helped distinguish procedural contamination from sample-derived particles.

Blank controls are not optional. A study of procedural blanks collected by 12 laboratories found suspected microplastic contamination between 7 and 511 particles, with a mean of 80 particles per sample. A “none detected” result reported without accompanying blank data cannot be interpreted. The blank establishes what the method itself introduces, and without it the result remains unanchored.
Substrate choice also affects data quality directly. One published standard, ISO 16094-2:2025, designates Raman microscopy as the reference technique for the 1–20 µm size range. It recommends silicon filters for particles at or above 1 µm and aluminum-coated polycarbonate filters for particles down to 500 nm.
The table below compares four method-standard combinations across their validated lower limits, typical upper limits, and primary interference. Every figure comes from the cited source.
| Method and standard | Validated lower limit | Typical upper limit | Primary interference |
|---|---|---|---|
| SWB-MP2-rev1 Raman | >20 µm (routine verification) | 5,000 µm | Fluorescence from pigments, organic matter, degraded polymers |
| SWB-MP1-rev1 FTIR | >50 µm (routine verification) | 5,000 µm | Water absorption, carbon black, organic matter |
| ISO 16094-2 Raman | 1 µm | 5,000 µm | Fluorescence from pigments, organic matter, degraded polymers |
| ISO 16094-2 FTIR | 1 µm | 5,000 µm | Water absorption, carbon black, organic matter |
ISO 16094-2:2025 is not automatically interchangeable with the California SWB methods. Method, matrix, laboratory validation, and equivalence must be reviewed separately before ISO 16094-2 data can support a verification decision aligned with the SWB framework. Raman microscopy is recognized as appropriate for chemical characterization but is not the primary regulatory requirement for routine water monitoring under current EU frameworks, which specify infrared microscopy. The chosen method must match the matrix, the particle-size fraction of interest, and the claim being supported.
Manual particle selection, where analysts visually identify particles under a microscope and then acquire Raman spectra at those positions, introduces operator bias. Automated Raman mapping scans predefined areas on a filter membrane systematically, acquires spectra at each position, and matches them against a spectral library.
Random Window Sampling is a statistically structured approach to automated mapping. Randomly selected windows of the filter surface are analyzed instead of the entire filter. Jüngling et al. (2026) highlight the importance of particle density per measurement window in automated Raman analysis. High particle density can cause spectral overlap and reduce identification confidence.
Subsampling introduces its own uncertainty. Particle distribution across a filter is rarely uniform. A sample with high local particle density in one region and low density in another will yield different results depending on which windows are selected. Any verification dataset that relies on subsampling must document the sampling strategy, the number of windows analyzed, and the particle density per window. That documentation allows reviewers to assess the uncertainty introduced by subsampling.
Raman throughput is low and scales with the number of measurement points and sample complexity, which makes it less efficient for high-volume workflows than infrared laser imaging. For verification purposes, that trade-off is acceptable when the particle-size fraction of interest falls below 50 µm, where Raman’s higher spatial resolution is necessary.
A non-detect result in a microplastics report is always a bounded statement. It means no reportable particles were found above the method’s detection floor, within the polymer panel tested, in the lot sampled, using the documented contamination controls. It does not mean no plastic is present.
The boundaries that define a non-detect result work together as follows:
A 2026 Frontiers in Environmental Science review states that detection floors should not be conflated with actual absence of particles below the cutoff, because environmental processes and biological impacts do not follow analytical definitions.
The California State Water Board’s SWB-MP2-rev1 provides one published analytical framework that organizations may adopt as a reference point for microplastics testing. It specifies validated detection ranges, sample preparation requirements, contamination controls, and reporting categories. ISO 16094-2:2025 provides an international reference for vibrational spectroscopy in waters with low suspended solids and may serve as an analytical reference where method, matrix, laboratory validation, and equivalence are reviewed and accepted. It is not automatically interchangeable with the California methods.
The Wellness Quality Institute’s review standard, WQI-CS-01, aligns with the California State Water Board’s drinking-water microplastics reference framework. Organizations that pursue Plastic-Free Pathway Verification submit their existing independent laboratory datasets for review against WQI-CS-01’s defined criteria. These criteria specify a minimum target polymer panel (PE, PP, PET, PS, PVC, PA, PC, and PMMA), required reporting categories, defined particle-size fractions, and laboratory qualification tiers. Every Standard Met outcome produces a scope-locked public registry entry that records the verified product, tested size range, polymer panel, reporting limits, testing laboratory and its accreditation, and verification period. Any buyer, retailer, or journalist can then check exactly what was reviewed.
California did not create, approve, authorize, or endorse the Wellness Quality Institute or its standard. Alignment with California’s framework serves as a technical reference point, not a geographic boundary or a government endorsement. WQI verification is available to US companies nationally.
Raman spectroscopy has a meaningful advantage in the sub-20 µm range because its shorter laser wavelength produces a smaller focal spot than the mid-infrared wavelengths used in FTIR. In practical terms, FTIR encounters a diffraction limit at approximately 10–20 µm, below which particles cannot be reliably identified regardless of instrument sensitivity. Raman can reach down to 1 µm under ISO 16094-2 conditions and further in optimized research settings. That advantage comes with trade-offs. Raman is slower, more susceptible to fluorescence interference, and more sensitive to sample preparation quality than FTIR. For routine verification workflows where the particle-size fraction of interest is above 50 µm, FTIR’s higher throughput and lower fluorescence sensitivity often make it the more practical choice. For fractions between 20 µm and 50 µm, Raman is the preferred method under the California SWB framework. Neither method reliably characterizes the nanoplastic fraction below 1 µm in routine commercial workflows.
Substrate choice is one of the most consequential decisions in a Raman microplastics workflow because the filter itself sits directly in the laser path. Silicon membrane filters are fully compatible with Raman spectroscopy and introduce no fluorescence interference. They also transmit mid-infrared light, which makes them suitable for combined Raman and FTIR workflows. Gold-coated or aluminum-coated polycarbonate filters provide an inert, non-fluorescent surface that yields clean spectra, with pore sizes available down to 0.1–0.4 µm for retention of very small particles. Aluminum oxide (Anodisc) filters, which are standard for infrared transmission work, are incompatible with Raman because the aluminum oxide matrix produces strong laser-induced fluorescence. Nitrocellulose filters are also unsuitable because laser exposure can thermally damage or ignite the membrane. Glass fiber filters can be used with caution, but the glass itself contributes a Raman scattering background that analysts must account for during spectral interpretation.
Automated Raman mapping is generally preferable to manual particle selection for verification purposes because it removes operator bias and provides a documented, reproducible sampling strategy. Manual visual pre-screening introduces selection bias that is difficult to quantify or correct later. Automated mapping with Random Window Sampling enables statistically structured coverage of the filter surface and produces a documented record of which areas were analyzed. Automated mapping also introduces constraints. Particle density per measurement window affects material identification accuracy, and subsampling always introduces uncertainty from uneven particle distribution. A verification dataset based on automated mapping must document the sampling strategy, window count, particle density per window, and the software and spectral library used. That documentation allows independent assessment of the uncertainty introduced by subsampling. Automated mapping does not remove the need for blank controls or chain-of-custody documentation.
A blank is a control sample processed through the entire analytical procedure, including digestion, filtration, and Raman analysis, using the same reagents, equipment, and handling as the actual sample but without the product being tested. Its purpose is to show what the method itself introduces, such as particles from reagents, airborne contamination, laboratory plasticware, or the filter substrate. Without a blank, there is no basis for distinguishing particles that came from the product from particles that came from the laboratory. As noted earlier, procedural blanks can contain substantial contamination, with one multi-laboratory study reporting means of around 80 particles per sample, which makes blank reporting essential for interpretation. A “none detected” result reported without accompanying blank data may reflect a clean product, a contaminated laboratory, or both. For a non-detect result to support any claim, the blank must be reported alongside the sample result, and the reporting limit must be derived from the blank distribution in the actual sample matrix rather than from vendor specifications on clean reference materials.
Raman spectroscopy, applied under the SWB-MP2-rev1 framework, provides defensible microplastics identification data within the validated range discussed throughout this article. It outperforms infrared spectroscopy for smaller particles in that range, and its chemical fingerprinting capability makes it the preferred method for confirmatory identification at the single-particle level. Its limitations, including fluorescence interference, low throughput, strong matrix dependence, and a detection floor that leaves the 1–20 µm fraction unvalidated and the nanoplastic range unreachable, represent the current boundaries of what the science can support.
A laboratory report, however rigorous, does not automatically become a defensible market claim. Independent review against a defined standard that assesses laboratory qualification, method suitability, polymer panel, reporting limits, blank controls, chain of custody, and scope converts raw data into a claim a brand can stand behind. The Wellness Quality Institute’s Plastic-Free Pathway Verification program, governed by WQI-CS-01, provides that review for US companies. It produces scope-locked outcomes with approved claim language and a public registry entry that any buyer or journalist can check.
No verification can confirm the complete absence of plastic. Verification can confirm that a company’s laboratory data has been independently reviewed against defined criteria and that the data supports genuine progress toward plastic-free standards within the tested range, for the reviewed product, during the reviewed production period. That is the strongest honest claim the science currently allows, and it is the only one worth making.
Water Quality

Learn how to test city or well water, read results, and spot microplastics. The Wellness Quality Institute helps brands verify plastic-related claims.
Read article
The Wellness Quality Institute explains California's microplastics rules—MCLs, notification levels & basin plans—to keep your claims defensible.
Read article
The Wellness Quality Institute helps brands verify water quality claims with independent testing. Build consumer trust with solid evidence. Start now.
Read article