
Home Water Testing: City, Well Water & Microplastics
Learn how to test city or well water, read results, and spot microplastics. The Wellness Quality Institute helps brands verify plastic-related claims.
Read articleThe Wellness Quality Institute helps U.S. brands turn polymer & microplastics lab data into verified claims. Start your testing program this August.

Written by: Scott Steveson, Specialist, Wellness Quality Institute
National Water Quality Month concentrates public and media attention on what is in drinking water, and that spotlight increasingly includes polymers. In April 2026, the U.S. Environmental Protection Agency added microplastics to the Draft Contaminant Candidate List 6 (CCL 6), which is the first formal step toward possible federal drinking-water regulation, although the listing itself does not create compliance duties for utilities. The EPA’s proposed Sixth Unregulated Contaminant Monitoring Rule, published in the Federal Register on July 1, 2026, chose not to require microplastics monitoring for the next five years because no validated EPA or consensus drinking-water test method yet meets nationwide quality-control expectations.
That gap between regulatory intent and validated methods creates uncertainty that puts brands at risk. Claims can move faster than proof, while buyers, retailers, and investors ask for clearer evidence. August offers a natural checkpoint to review existing lab datasets, find gaps, and decide what current data truly supports before any public statement or marketing claim.
California provides the most advanced U.S. reference point. The State Water Resources Control Board adopted standard methods in 2022 and phased microplastics monitoring and reporting for utilities from Fall 2023 through Fall 2028, with an interim assessment period in 2025–2026, creating the most detailed emerging U.S. dataset on microplastics in treated drinking water. California and Michigan have initiated monitoring programs or studies for microplastics in water, signaling a clear direction of travel even without federal limits.

Polymer testing in water falls into three working categories, and each one answers a different business question using different tools.
Category 1 — Particle-resolved spectroscopic identification. These methods identify individual particles by polymer type and size, which makes them central to drinking-water microplastics work. Micro-FTIR (Fourier-transform infrared spectroscopy) and micro-Raman spectroscopy are the main tools. They produce particle counts by polymer type, size band, shape, and color, which aligns closely with drinking-water microplastics frameworks. The California State Water Board has published two validated standard operating procedures in this category: SWB-MP1-rev1 (infrared spectroscopy) and SWB-MP2-rev1 (Raman spectroscopy). ISO 16094-2 describes a procedure using µFTIR and µRaman to measure microplastic particle counts by polymer type and size range in clean water such as drinking water, and the European Union’s Commission Delegated Decision (EU) 2024/1441 sets a harmonized approach for monitoring microplastics in drinking water using these same spectroscopic techniques.
Category 2 — Bulk polymer mass quantification. Pyrolysis gas chromatography–mass spectrometry (Py-GC/MS) heats polymers until they break into signature chemical fragments, then identifies and quantifies those fragments by mass. This approach does not provide particle counts or size data unless the sample is size-fractionated first with filters. It does, however, quantify specific polymer types such as polyethylene, polypropylene, PET, polystyrene, PVC, and nylon down to nanogram levels per polymer type, with detection limits that depend on the polymer and the sample matrix. A 2026 study in Analytical and Bioanalytical Chemistry showed that µ-FTIR and Py-GC/MS work best together rather than as substitutes: spectroscopy visually identifies the most abundant particles, while Py-GC/MS quantifies polymer types that spectroscopy may not see at all.
Category 3 — Emerging nanoscale methods. Atomic force microscopy–infrared spectroscopy (AFM-IR), optical photothermal infrared spectroscopy (O-PTIR), and surface-enhanced Raman spectroscopy (SERS) push into the nanoplastic range. A 2026 review in NPG Asia Materials reports that AFM-IR enabled quantitative detection of nanoplastics between 20 and 1,000 nanometers in drinking water treatment plant samples, and O-PTIR can also detect nanoplastics. These methods remain research-grade for most commercial programs and are not yet validated under the California State Water Board framework. A 2026 PRISMA-guided review concluded that conventional FTIR and routine Raman workflows do not provide true nanoscale analysis in drinking-water samples, and that no single method can characterize the full range of micro- and nanoplastic particles in environmental samples.
For commercial drinking-water programs, the practical choice usually narrows to the two California-validated spectroscopic methods, each with distinct strengths and limits. The comparison table below focuses on these two methods.
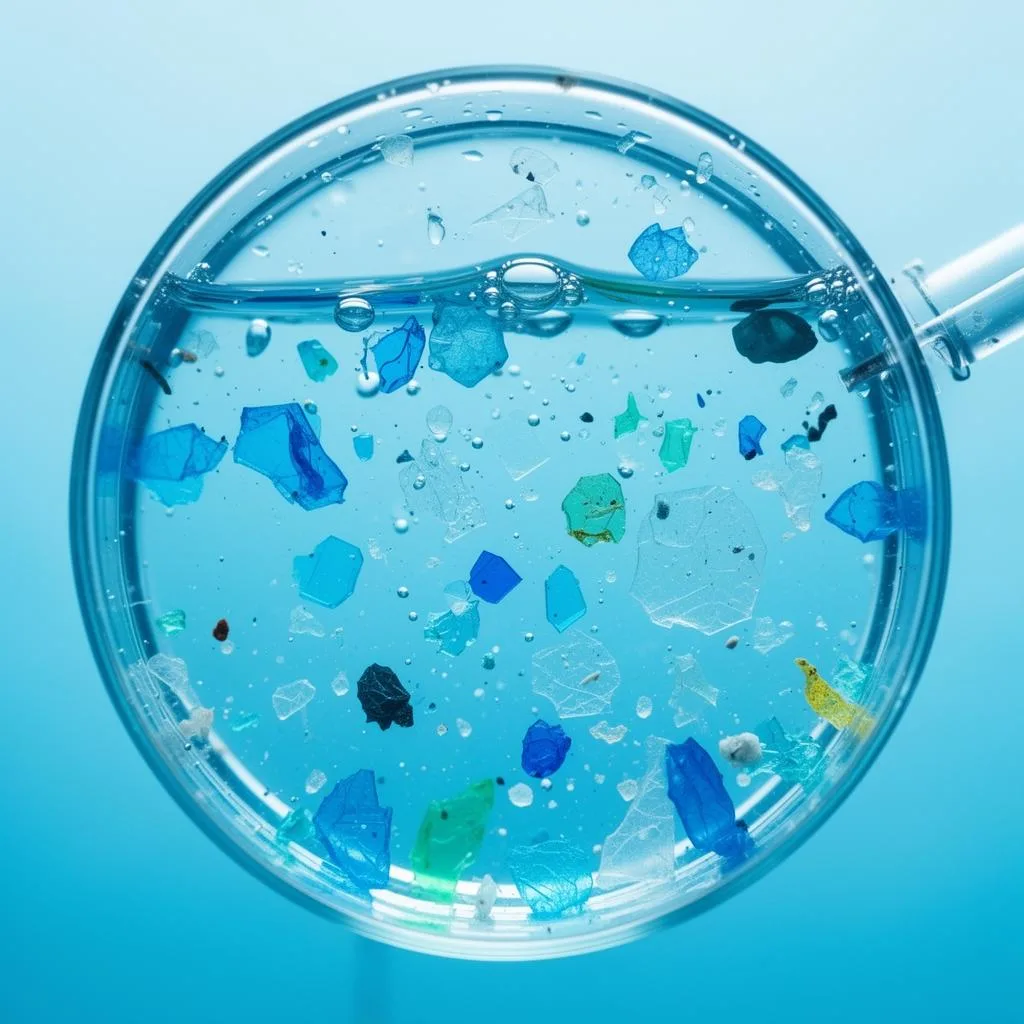
One number frames every discussion here. The California definition of microplastics in drinking water reaches down to 1 nanometer, while the best validated methods begin at 20 or 50 micrometers, which are thousands of times larger. The 1–20 µm fraction is not validated under either California method, and everything below 1 µm, the nanoplastic range, sits beyond reliable commercial measurement today. Any dataset that ignores this boundary tells only part of the story.
Many brands already have lab reports in hand, yet not every report can support a public claim. The Wellness Quality Institute, formally the Wellness Quality Institute (WQI), applies a defined evaluation framework under its WQI-CS-01 standard, and brands can use the same lens as a self-check before seeking third-party review.
Laboratory accreditation tier. The strongest datasets come from a California ELAP-accredited laboratory for the relevant State Water Board microplastics method. ISO/IEC 17025-accredited laboratories can also be suitable when the microplastics method and the specific product matrix, such as still water, sparkling water, or a simple beverage, appear explicitly in the accredited scope. Data from labs without documented accreditation for both method and matrix needs closer scrutiny.
Blank controls. Blank samples are containers that go through the full workflow without product, and they reveal contamination from the lab itself. A defensible nanoplastics workflow needs validated reference materials, clear detection and quantitation limits, blank controls, and cross-lab harmonization. A dataset that omits blank results cannot separate particles in the product from particles introduced during handling. A 2024 PNAS study that reported about 240,000 plastic particles per liter of bottled water later faced a PNAS commentary pointing to contaminated blanks and weak quality control, which illustrates why blank data is non-negotiable.
Reporting limits. A “none detected” result is limited by the method’s detection floor. A lab that reports “no microplastics detected” using an infrared method is saying that none were found above roughly 50 µm with that instrument on that lot. The result says nothing about smaller particles. Reports must state detection limits clearly, and a non-detect only carries weight when those limits match the expectations of the chosen framework.
Polymer panel coverage. A defensible drinking-water panel usually includes polyethylene (PE), polypropylene (PP), polyethylene terephthalate (PET), polystyrene (PS), polyvinyl chloride (PVC), polyamide (PA or nylon), polycarbonate (PC), and polymethyl methacrylate (PMMA). The report should also list other confirmed polymers and a category for unidentified particles with no spectral match. A panel that screens only a few polymer types leaves blind spots.
Chain of custody. Clear documentation that tracks the sample from collection through analysis is essential. Any gaps, such as missing transfer records or unclear storage conditions, weaken the dataset regardless of how strong the lab work appears.
Particle counts by size fraction. Particles should be labeled as microplastics only when spectral match confidence exceeds 70 percent, and counts should appear by size fraction instead of as a single total. Visual counting alone, without chemical confirmation, cannot support a defensible dataset.
A structured checklist helps brands and utilities build polymer testing programs that hold up under scrutiny. The items below reflect good practice, not legal requirements, and should be tailored to each product, production scale, and risk profile.
Per-dataset parameters to verify:
Frequency considerations:
“None detected” equals “none present.” “None detected” only means the method did not find target polymers above its detection floor in that lot. A method validated above 50 µm cannot see smaller particles, and the statement is limited by the method, the polymer panel, and the specific production run.
One test result covers an entire product line. A result applies only to the reviewed product, the tested size range, the polymer panel, the method, and the production or sampling period. Extending one product’s result across a line or brand turns credible data into a greenwashing risk.
Particle counts without chemical confirmation are enough. Counting tools such as nanoparticle tracking analysis, light obscuration, dynamic image analysis, or electrical sensing zone count all particles, not just plastics. They work best when paired with FTIR or Raman to confirm polymer identity. Counts without spectroscopy cannot separate plastic from mineral or organic particles.
Any method works for any matrix. Method fit depends on the product. Py-GC/MS mass-based quantification suits complex, particle-rich matrices such as wastewater, while µ-FTIR or µ-Raman are less suited to those samples. A method that works for still drinking water may not suit a cloudy beverage.
A lab report automatically equals a defensible claim. A lab report describes what the lab found. It does not judge whether the method fit the matrix, whether reporting limits were tight enough, whether blanks and controls were adequate, or what claim the data can support. Those questions require independent review.
The nanoplastic range is measurable with current commercial tools. Reliable coverage of the nanoplastic range is not yet available. EPA and NIST guidance notes that no single method can characterize the full diversity of micro- and nanoplastic particles in environmental samples, and current methods lack the needed sensitivity and reference materials for nanoplastics. Any claim that implies complete absence of nanoplastics goes beyond current science.
Independent review converts self-reported lab data into evidence that outside parties can trust. Self-reported results always carry less weight than independently reviewed data because the company interpreting its own results has a direct interest in the outcome, even when the lab work is sound.

The Wellness Quality Institute (WQI) serves as an independent verification body that reviews companies’ existing third-party lab data on plastic and microplastic content against its WQI-CS-01 standard, which aligns with the California State Water Board’s drinking-water microplastics framework. WQI does not run laboratory tests. It reviews the dataset, method, product scope, and controls that a company submits and then issues one of two outcomes: Standard Met or Standard Not Met.
What the review examines. Every WQI review checks laboratory accreditation, method choice and matrix fit, tested size range, target polymer panel, reporting limits, blank results and contamination controls, spike recoveries, replicates, chain of custody, data age, product scope, and production or sampling period.
What Standard Met provides. A Standard Met outcome requires two conditions together. The dataset must meet all technical and data-quality requirements, and no reportable target polymer particles can appear within the tested size range and approved reporting limits. A non-detect alone is not enough, because the reporting limits themselves must satisfy WQI criteria. Standard Met grants a scope-locked license to use the WQI mark (“WQI Plastic-Free Pathway Verified”), a public registry listing, and approved claim language tied to the specific evidence. The registry entry records the verified party, product scope, matrix, production or sampling period, tested size range, lower method limit, polymer panel, reporting limits, testing lab and its accreditation, verification and expiration dates, registry ID, approved result statement, and current status.
What Standard Not Met provides. A Standard Not Met outcome remains private. It carries no public claim, logo rights, or registry listing, and WQI does not describe it as a failed product. It often reflects missing data, an unsupported method, or incomplete scope rather than a product problem. Companies can resubmit with stronger information, so participation carries no public downside.
What verification does not claim. A Standard Met outcome does not claim absence of plastic below the method floor, outside the tested range, outside the reviewed polymer panel, below the reporting limit, outside the registered product scope, or outside the registered production period. The “WQI Plastic-Free Pathway Verified” mark describes a company on a verified pathway toward plastic-free standards, not a product proven to contain zero plastic. No lab today can confirm complete absence of plastic across every size, polymer type, and production lot, and WQI does not suggest otherwise.
A single assessment fee covers review, verification decision, and registry listing. Independent lab testing is arranged and billed separately by a qualified lab, and payment of the assessment fee does not guarantee a Standard Met decision.
WQI Plastic-Free Pathway Verification does not certify that a product contains zero plastic, microplastics, or nanoplastics. It shows that the company is on a verified pathway toward plastic-free standards. Verification applies only to the reviewed products, submitted datasets, tested ranges, polymer panels, production or sampling periods, and supporting controls. WQI verification is not a California approval, government certification, or health or safety certification.
National Water Quality Month 2026 arrives as polymer testing shifts from voluntary best practice to baseline expectation, driven by EPA’s addition of microplastics to the Contaminant Candidate List, state monitoring rollouts, retailer pressure, and growing research on polymers in water and human tissue. The gap between what brands claim and what their data supports is closing as a legal and reputational issue, not just a scientific one.
A practical path forward starts with an honest audit of existing lab datasets against the criteria in this guide. Brands can then identify what their data truly supports, commission additional testing where gaps appear, and seek independent review that converts qualified datasets into defensible, scope-locked claims.
The Wellness Quality Institute (WQI) exists to connect real laboratory data with claims that companies can stand behind, using approved language, a public registry entry, and independent oversight that self-reporting cannot match.
Microplastics are plastic particles smaller than 5 millimeters, and at the larger end of that range they can be counted and chemically identified with current lab tools. Nanoplastics are particles smaller than 1 micrometer, roughly one-thousandth of a millimeter. The difference matters because these size classes require different analytical approaches, and the nanoplastic range currently sits beyond reliable commercial testing. The California definition’s 1-nanometer lower bound and the validated methods’ detection floors, discussed earlier, create a gap thousands of times larger than the regulatory definition covers. That gap explains why no lab today can confirm complete absence of plastic in any product and why claims of total absence go beyond current science.
A minimum defensible polymer panel for drinking-water products includes polyethylene (PE), polypropylene (PP), polyethylene terephthalate (PET), polystyrene (PS), polyvinyl chloride (PVC), polyamide (PA or nylon), polycarbonate (PC), and polymethyl methacrylate (PMMA). These polymers most often appear in packaging, processing equipment, and environmental contamination routes. A complete dataset also includes categories for other confirmed polymers and for unidentified particles with no spectral match, because a panel that only reports what it looked for cannot address what it did not target. Polypropylene deserves special attention in bottled-water programs. A 2018 study led by Sherri Mason at the State University of New York at Fredonia, published in Frontiers in Chemistry, found that polypropylene, the material used in many bottle caps, was the most common polymer detected in bottled water, which points directly to packaging as a contamination route.
Several practical checks help here. Confirm that the lab was accredited for the specific method and matrix. Verify that blanks were run and reported. Look for clearly stated reporting limits. Check that the polymer panel covers at least the core types listed above. Confirm that chain of custody is documented. Make sure particle counts appear by size fraction with chemical confirmation, not just visual identification. Finally, confirm that the dataset matches the exact product and production period you plan to reference. Many brands discover that their data supports a narrower claim than they assumed, or that a “none detected” result sits above a detection floor that leaves much of the particle-size range untested. An independent review against a defined standard, such as the Wellness Quality Institute’s Plastic-Free Pathway Verification process, provides the clearest view of what a dataset can truly support.
As of August 2026, no enforceable federal microplastic limits exist for U.S. drinking water. The EPA added microplastics to Draft Contaminant Candidate List 6 in April 2026, which is a formal step toward possible future regulation, and the proposed Sixth Unregulated Contaminant Monitoring Rule published in July 2026 declined to require microplastics monitoring for the next five years because no validated EPA or consensus test method yet meets nationwide quality-control needs. California remains the leading reference point, with standard methods adopted in 2022 under Senate Bill 1422 and phased monitoring rollouts as described earlier. As noted earlier, California and Michigan have led state-level monitoring efforts. The lack of federal limits does not reduce retailer, consumer, or litigation pressure on brands making polymer-related claims and instead increases the value of independent third-party review as a credibility tool.
Scope-locked verification applies only to the specific product, size range, polymer panel, analytical method, production or sampling period, and controls that were reviewed. It does not extend to other products, a full product line, or the company overall. This boundary matters because scope creep is the most common way credible data turns into a greenwashing problem. A brand tests one SKU, receives a favorable result, and then applies that result across an entire range. Scope locking blocks that extension. Every WQI verification includes a public registry entry that lists exactly what was reviewed, so buyers, retailers, and journalists can see the precise limits of the claim instead of relying on broad marketing language. A claim narrow enough to be accurate is the only claim that stands up under scrutiny.
Water Quality

Learn how to test city or well water, read results, and spot microplastics. The Wellness Quality Institute helps brands verify plastic-related claims.
Read article
The Wellness Quality Institute explains California's microplastics rules—MCLs, notification levels & basin plans—to keep your claims defensible.
Read article
The Wellness Quality Institute helps brands verify water quality claims with independent testing. Build consumer trust with solid evidence. Start now.
Read article